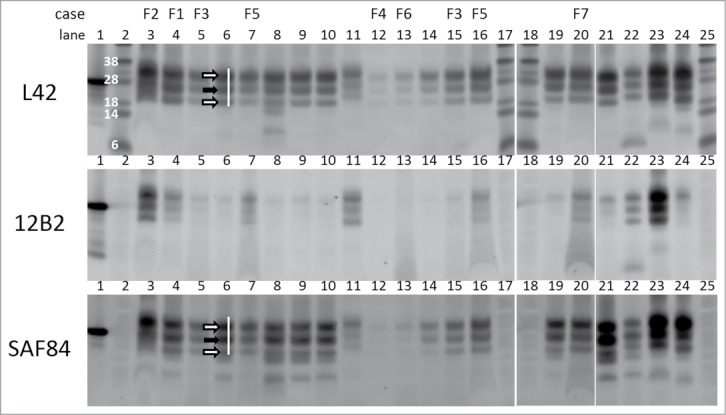
Figure 1.

Triplex-WB analysis picture of study cases together with some reference samples. Selection of samples analyzed include all study cases numbers F1–F7. All lanes contain ovine samples except lanes 10 and 22, respectively caprine CH1641 Cgt and bovine BSE-H. Lanes 6, 8, 9, 14, 19, and 21: ovine CH1641 samples C8, C9, C1, C7, C3, and C6; lane 11 experimental scrapie J1; lanes 23 and 24 respectively ovine classical scrapie N18 and BSE B4 (details of case codes in Table 1). In the triplex‑WBs a mix of the 3 antibodies L42, 12B2 and SAF84 was applied. As an example for the glycoprofile estimation, the white bar shows the typical triple band (3 arrows) area in the L42 and SAF84 channels, thus neglecting the 2 lower bands that are visible in CH1641 samples. The migration position of mono‑glycosylated PrPres fraction (at ± 24 kDa) is indicated with a black arrow, the di-glycosylated and non-glycosylated fractions (white arrows) migrate respectively above and below the 24kDa band in this triplet region. Marker proteins used are: rec‑ovPrP in lane 1; molecular mass markers in lanes 2, 17, 18 and 25 with in lane 2 the molecular masses in kDa. TE applied per lane: 0.5 mg in lanes 3, 21–24, 0.8 mg in lane 7, 1 mg in lanes 4–6, 8–16, 19–20. See Methods section for antibody details and fluorescence detection.
