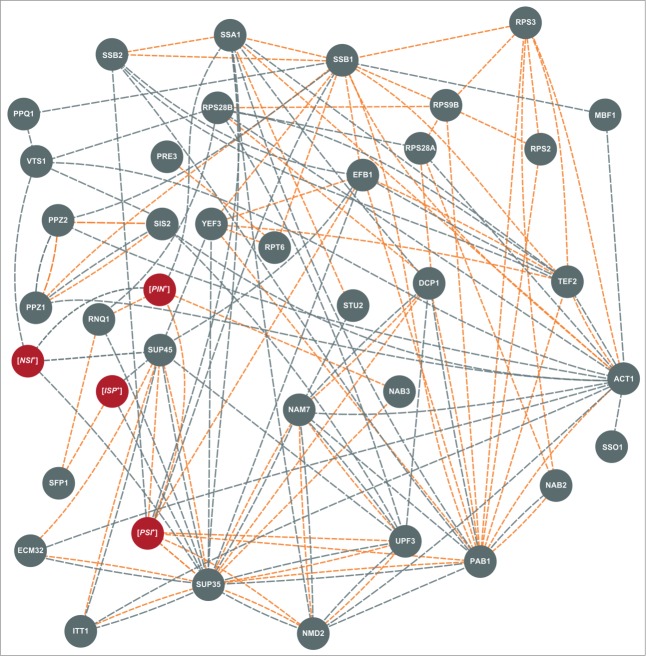
Figure 2.
Interaction network of the genes and factors affecting nonsense readthrough in S. cerevisiae. Genetic factors are indicated as gray circles, epigenetic – as red circles. Different lines indicate different types of interactions between suppressors: physical interactions are shown in orange, genetic – in gray. The data on interactions were obtained and combined from “BioGrid” (http://thebiogrid.org/), “GeneMANIA” (http://genemania.org/), “Saccharomyces Genome Database” (http://www.yeastgenome.org/) and, in some cases, from papers cited in this review.

