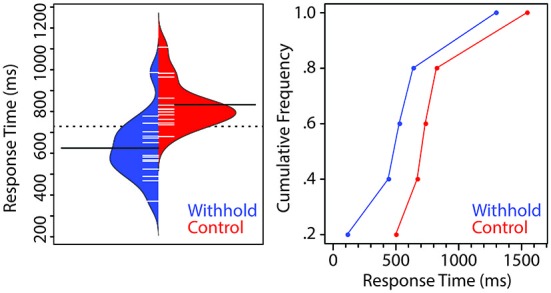
Figure 2.

Left. Beanplot of the group-average response times (RTs) for the withhold (blue) and control (red) conditions. The dashed line indicates the group mean whereas the two filled lines indicate the mean of each condition. Each short line represents the median RT of each participant. Right. Cumulative distribution of participants’ RTs as a function of condition.
