
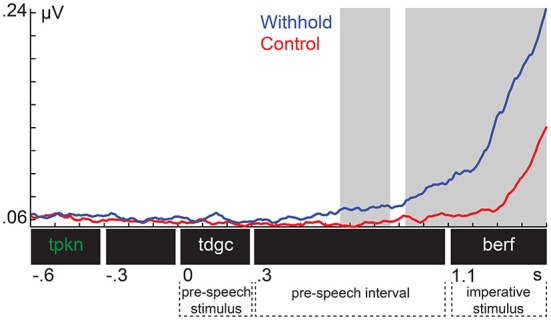
Figure 3.
Group-level electromyogenic activity from the orbicularis oris muscle for the withhold (blue) and control (red) condition. Shaded areas indicate the time intervals associated with the significant clusters.
Official websites use .gov
A
.gov website belongs to an official
government organization in the United States.
Secure .gov websites use HTTPS
A lock (
) or https:// means you've safely
connected to the .gov website. Share sensitive
information only on official, secure websites.
Group-level electromyogenic activity from the orbicularis oris muscle for the withhold (blue) and control (red) condition. Shaded areas indicate the time intervals associated with the significant clusters.