Figure 4.

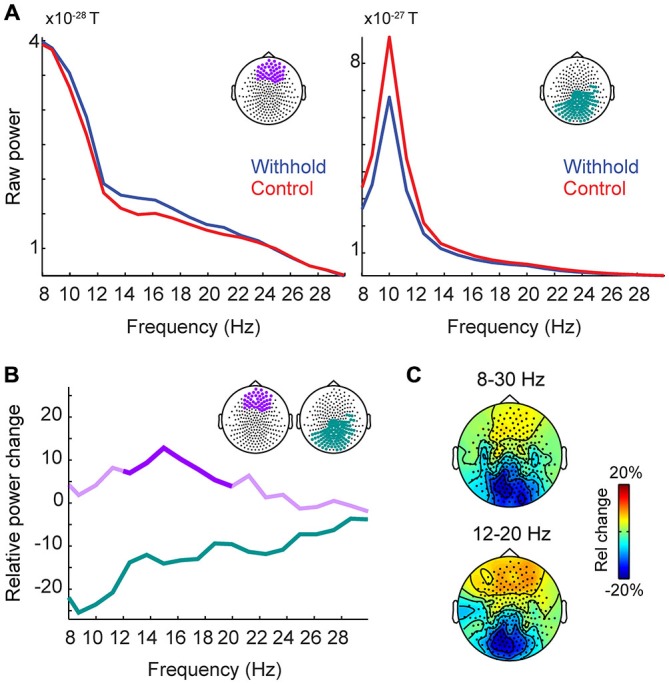
Group-level raw power and relative power changes (withhold vs. control) during the pre-speech interval. (A) Group-level raw power spectra averaged over a group of frontal sensors (left panel) and posterior sensors (right panel) for the withhold (blue) and control (red) conditions. (B) Group-level relative power spectra averaged over a group of frontal (purple) and posterior (green) sensors as shown in the top right corner of panel (B). Significant frequency ranges are indicated by stronger colors (frontal sensors: 12–20 Hz; posterior sensors: 8–30 Hz). (C) Group-level topographical maps of the relative power changes for two frequency ranges (8–30 Hz and 12–20 Hz), indicated on top of each map. Rel, relative.
