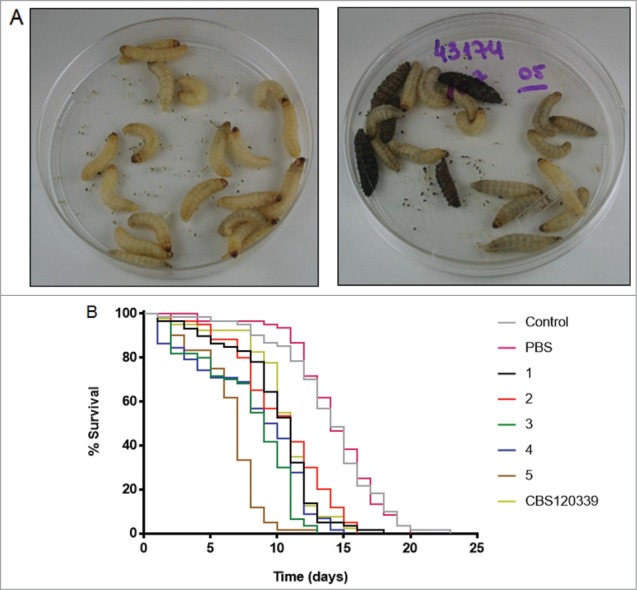
Figure 4.

Galleria mellonella infection model. (A) Photographs of 2 groups of larvae (PBS [left] and isolate 5 [right]) 2 days after injection; the five dark brown / black larvae were dead. (B) Survival curves of the larvae. Lines represent the percentage of live individuals at each day. Control: uninfected larvae; PBS: larvae inoculated with 10 μL sterile PBS; numeric codes: larvae inoculated with 107 yeasts of each isolate, or with the reference CBS strain of S. brasiliensis in 10 μL sterile PBS. The larvae were maintained at 37°C. N = 60 larvae per group.
