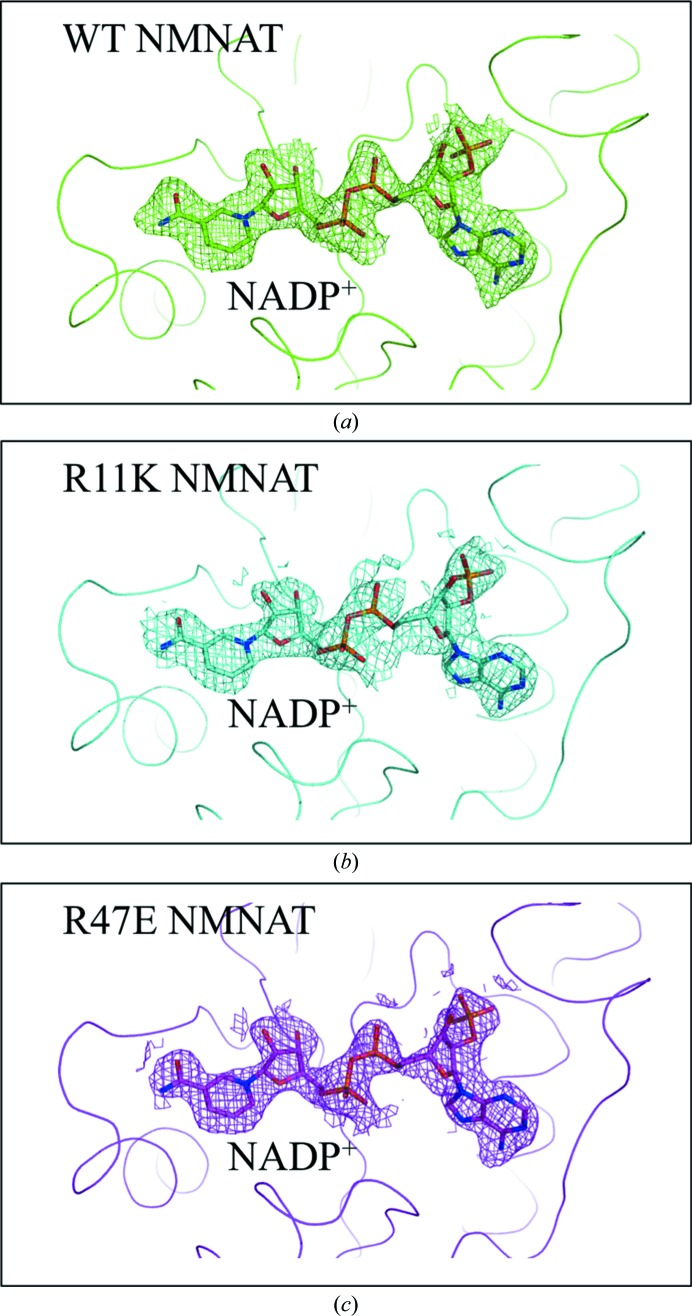
Figure 2.
Difference Fourier maps of WT and mutant NMNAT enzymes. Difference Fourier maps of (a) WT NMNAT, (b) Arg11Lys NMNAT and (c) Arg47Glu NMNAT after the first round of refinement, indicating the presence of NADP+ in the active site. The refined model of NADP+ is shown. All of the maps are contoured at 1σ.

