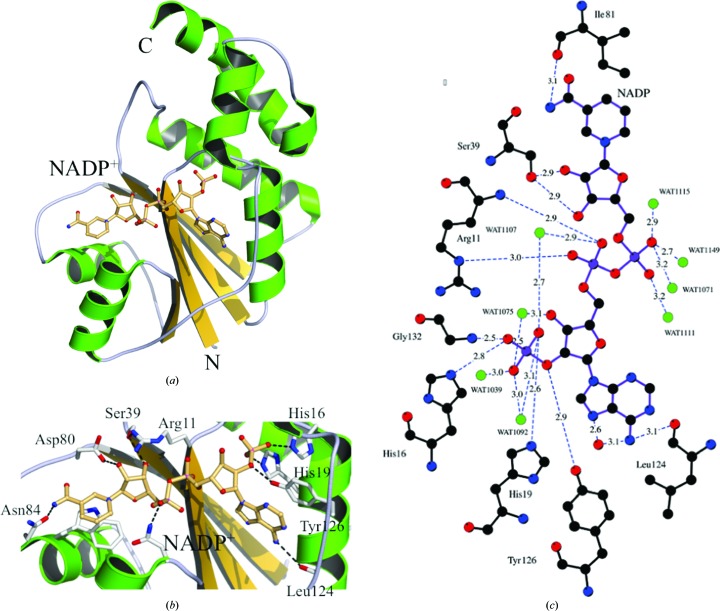
Figure 3.
Active-site interactions in the WT NMNAT–NADP+ complex. (a) Ribbon diagram of NMNAT with helices shown in green and strands in yellow. The molecule of NADP+ is shown in ball-and-stick representation. (b) Interacting NMNAT residues and NADP+ are shown in ball-and-stick representation. The most notable interactions are between the 2′-phosphate of NADP+ and NMNAT residues His16 and His19. The NADP+ adenine ring also stacks with the side chain of Tyr126. (c) Schematic representation of the interactions between WT NMNAT and NADP+. The distances and identities of the polar interactions are shown and are described in the text. Identical interactions occur between Arg11Lys and Arg47Glu NMNAT with NADP+ but have not been shown.

