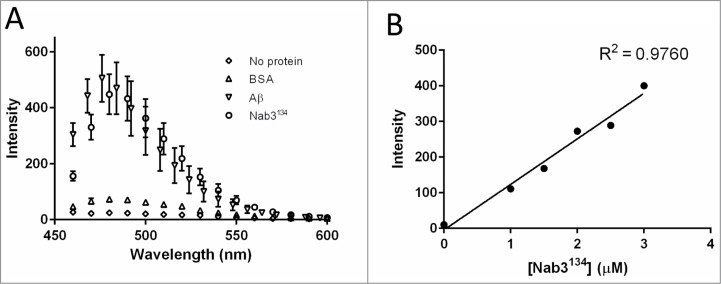
Figure 5.
Fluorescence spectroscopy of thioflavin T binding to Nab3134 and Aβ. (A) Thioflavin T was mixed with the indicated proteins (2 μmolar each, except BSA which was 20 μM) and the spectra of fluorescence was scored in a spectrofluorometer in triplicate and averaged. Error bars show the standard deviation around those averages. (B) Increasing amounts of Nab3134 protein were added to thioflavin and absorbance at 485 nm was quantified and plotted. The correlation coefficient (R2) was calculated with Prism 6.02 software (GraphPad).

