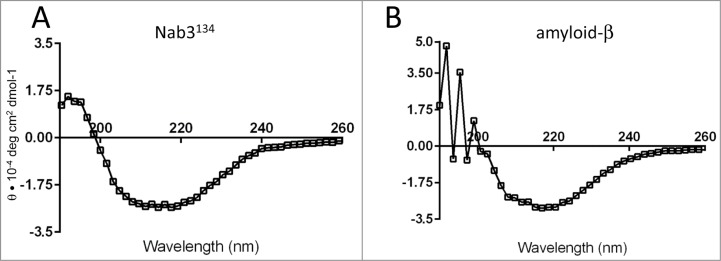
Figure 6.
Circular dichroism spectroscopy of Nab3134 and Aβ. Suspensions of Nab3134 and Aβ (1–40) were independently analyzed by CD spectroscopy as described in Materials and Methods. A representative spectrum is shown for each. θ was calculated and plotted at 1.6 nm intervals. Lines connect the average values. Nab3134 was read in a 0.2 mm path length cuvette and Aβ was read in a 1 cm path length cuvette.

