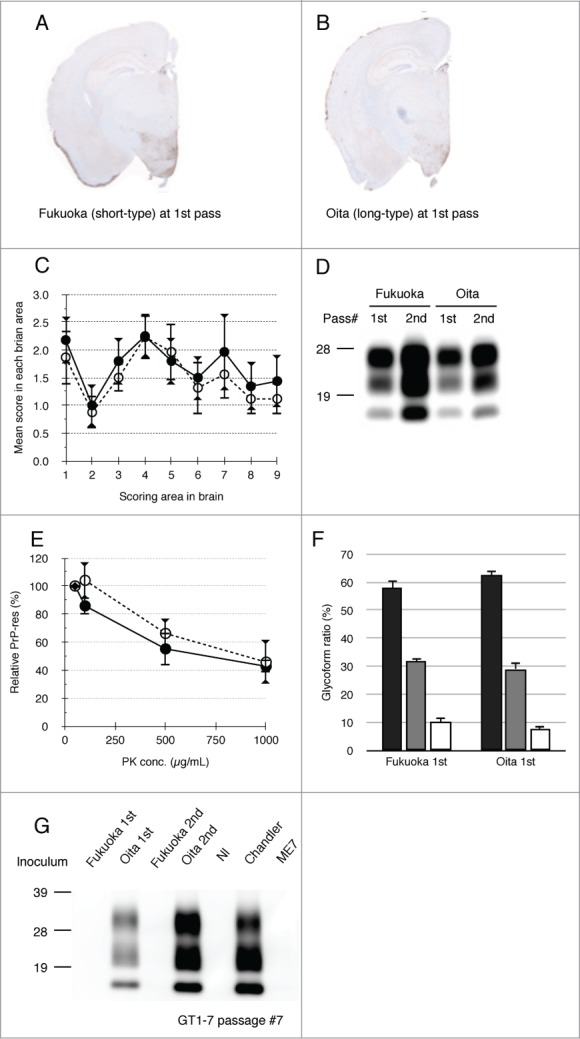
Figure 3.

Biochemical and biological properties of short- and long-type prions in primary-passaged mouse brains. PrPSc distributions of primary-passaged Fukuoka and Oita affected mice are shown, respectively (A and B). Immunostaining was performed using the mAb SAF84. The coronal sections at the level of the hippocampus are shown. Lesion profiles of Fukuoka- and Oita-affected mice in 9 brain areas at first passage (C). The brain vacuolation of Fukuoka- (closed circle) and Oita-affected mice (opened circle) was scored on a scale of 0 to 5 (mean value ± standard deviation). The brain areas are as indicated in Figure 1. Representative protein gel blot of PrPSc in Fukuoka- and Oita-affected mice (D). The name of the isolate and passage number in mice are indicated on the top of panel. For each sample, 10 μg of total protein was loaded per lane and probed with mAb SAF84 to detect PrPSc. Molecular markers are indicated on the left side. PK sensitivity of PrPSc between Fukuoka- and Oita-affected mice at first passage is compared (E). Closed circles and opened circles represent the results of Fukuoka- and Oita-affected mice, respectively. PrPSc was detected with mAb 6H4. Data represent the mean ± standard deviation from 4 to 5 independent experiments. Glycoform profiles of PrPSc in Fukuoka- and Oita-affected mice at first passage (F). PrPSc was detected with mAb 6H4. Signal intensities of di-, mono-, and non-glycosylated PrPSc bands were analyzed. Black bar: ratio of diglycosylated PrPSc to total PrPSc. Gray bar: ratio of mono-glycosylated PrPSc to total PrPSc. White bar: ratio of non-glycosylated PrPSc to total PrPSc. Values are expressed as the mean ± standard deviation (%). Representative western blot of GT1–7 cells exposed to Fukuoka (short-type isolate) and Oita (long-type isolate) is shown (G). Inocula used in this study are indicated on the top of each lane. Nl indicates the use of an uninfected mouse brain homogenate as the inoculum. PrPSc was detected by mAb T2. Molecular markers are indicated on the left side of panel. Total protein (500 μg) was loaded into each lane except for the lane of Chandler (80 μg).
