
Figure 2.
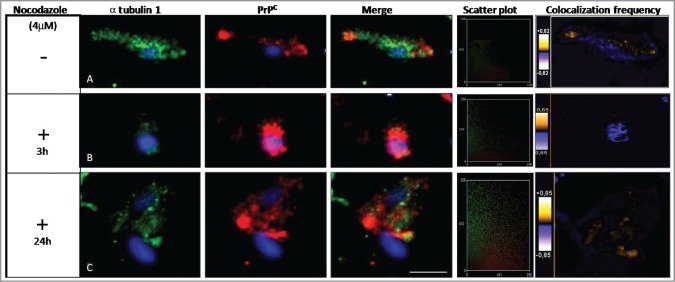
Effect of nocodazole on α tubulin 1 and PrPC colocalization. HpL3–4 cells were transfected with Prnp (PrP+/+) and then treated with nocodazole (4 μM) for different time intervals. α tubulin 1 (green) and PrPC (red) were stained in (A) untreated cells and in nocodazole treated cells (3 and 24 hours) (B-C). Nuclei were stained with TO-PRO-3 fluorescent dye (Life-technologies). Distribution of PrPC and α tubulin 1 were analyzed using anti-PrPC (3F4) and anti-α tubulin 1 antibodies (Leica TCS SPE microscope). The scatter plots show the quantitative localization of α tubulin 1 and PrPC. After 3 h of treatment with nocodazole there was a significant loss of colocalization between α tubulin 1 and PrPC as compared to untreated cells. After 24 h of treatment colocalization of both proteins increased. At least 25 cells were observed per condition per experiment with an equal exposure time (Scale bar: 10 μm). The scatter plots of the individual pixels from paired images were generated by Image (WCIF plugin) software.