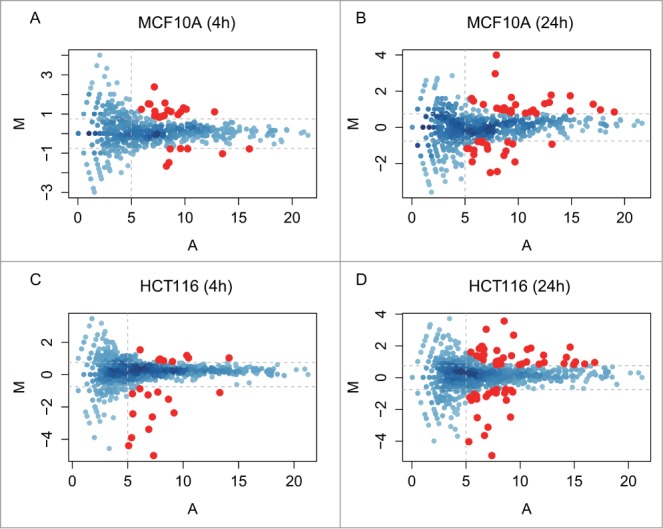
Figure 3.

miRNA expression during the DDR in MCF10A and HCT116 cells over time. The MA plots in the panels plot for each miRNA species the values of the log fold change (M) against the average abundance (A). We chose as significant those changes in which M ≥ or ≤0.75 (horizontal dotted lines), and A ≥ 5 (vertical dotted lines), i.e., ≥1.68-fold increase or decrease in differential expression (M) and a count rate of ≥32 (A). The MA plot analysis shows 4 comparisons: A, MCF10A 4 h vs 0 h; B, MCF10A 24 h vs 0 h; C, HCT116 4 h vs 0 h; D, HCT116 24 h vs 0 h. miRNAs exhibiting a statistically significant change are color ed in red (p-value < = 0.05).
