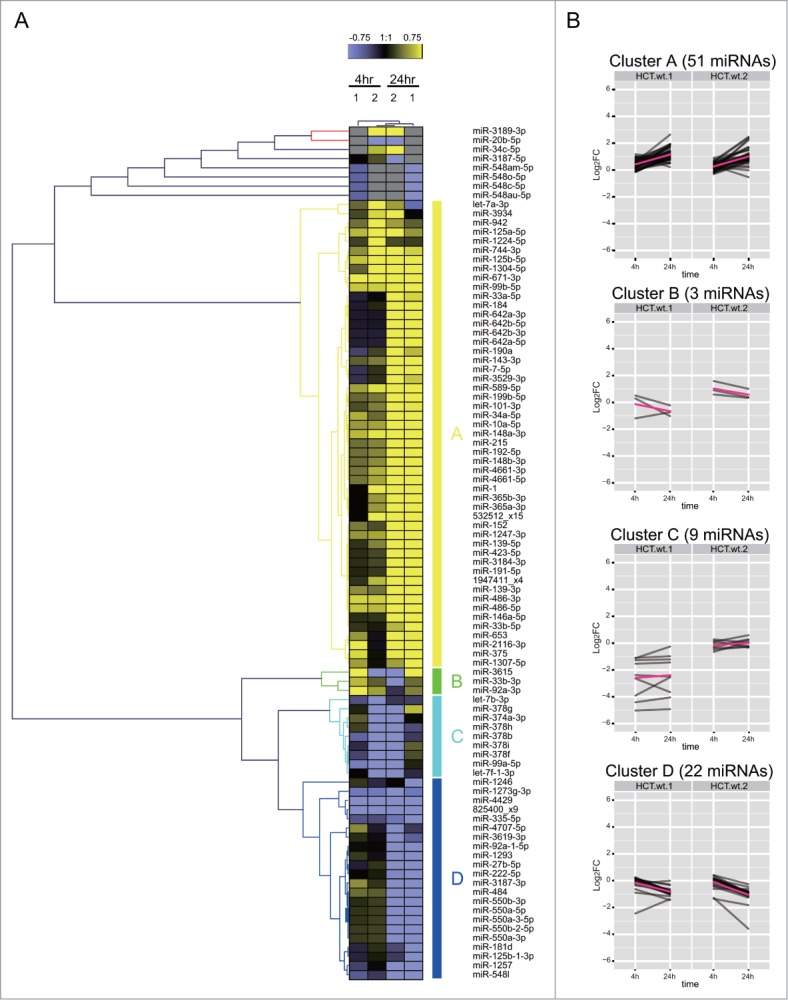
Figure 5.

Cell-type dependent patterns of miRNA expression during the DDR. (A) shows the heat map of expression patterns for 93 DDR-responsive miRNAs in HCT116 cells at 4 h and 24 h after DNA damage, compared to their expression at 0 h. Two technical replicates (1 and 2) were analyzed for each condition. Each row represents a specific miRNA species. miRNAs were clustered by (B) shows the heat map of expression patterns for 93 DDR-responsive miRNAs in HCT116 cells at 4 h and 24 h after DNA damage, compared to their expression at 0 h.
