Figure 6.

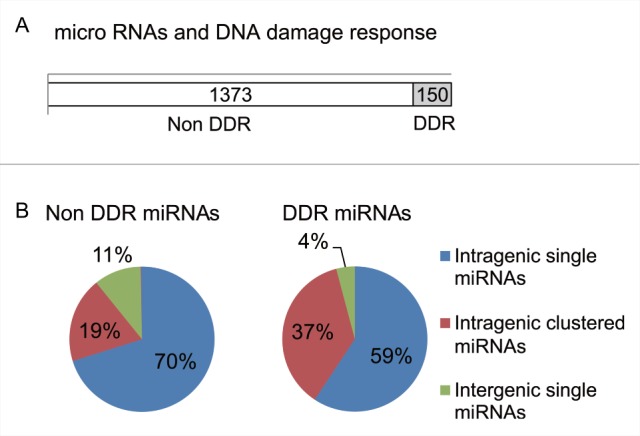
The distribution pattern of DDR miRNAs. (A) Shows the distribution in the human genome of loci encoding miRNAs whose expression is altered in response to DNA damage (DDR miRNAs). Open column represents miRNAs that were not induced by DNA damage. Grey color ed column include miRNAs that responded to 5Gy ionizing radiation. (B) Pie chart represents the percentages of miRNAs by the site on the genome. Intragenic single miRNA are shown in blue, intragenic miRNAs with the cluster in red and intergenic single miRNAs in green, respectively.
