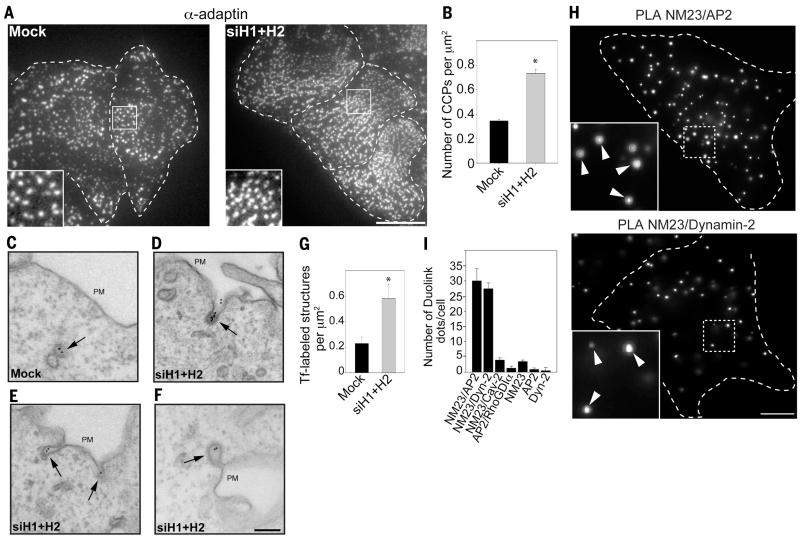
Fig. 2. Accumulation and tubulation of clathrin-coated pits in the absence of NM23-H1/H2.
(A and B) AP-2 staining (α-adaptin) reveals higher CCP density in HeLa cells knocked down for NM23-H1/H2. Scale bar, 5 μm. Graph in (B) represents the mean CCP number/μm2 ± SEM (n = 10 cells for each condition). *P < 0.05 compared with mock-treated cells. (C to F) HeLa cells mock-treated (C) or silenced for NM23-H1/H2 [(D) to (F)] were allowed to internalize Tf-Biotin for 4 min at 37°C and analyzed with electron microscopy by means of immunogold labeling with anti-Biotin antibodies and protein-A gold conjugates. Scale bar, 200 nm. (G) Number of Tf-positive structures (CCPs and vesicles)/μm2 in a 1.9 μm-wide region, including the plasma membrane. *P < 0.05 compared with mock-treated cells. (H) PLA signal using combination of NM23 and AP-2 (α-adaptin) antibodies (top), or dynamin-2 antibodies (bottom). (Insets) Higher magnification of boxed regions. Scale bar, 5 μm. (I) Quantification of PLA dots per cell using different antibody pairs as indicated (mean ± SEM, n = 30 cells/condition from three independent experiments).

