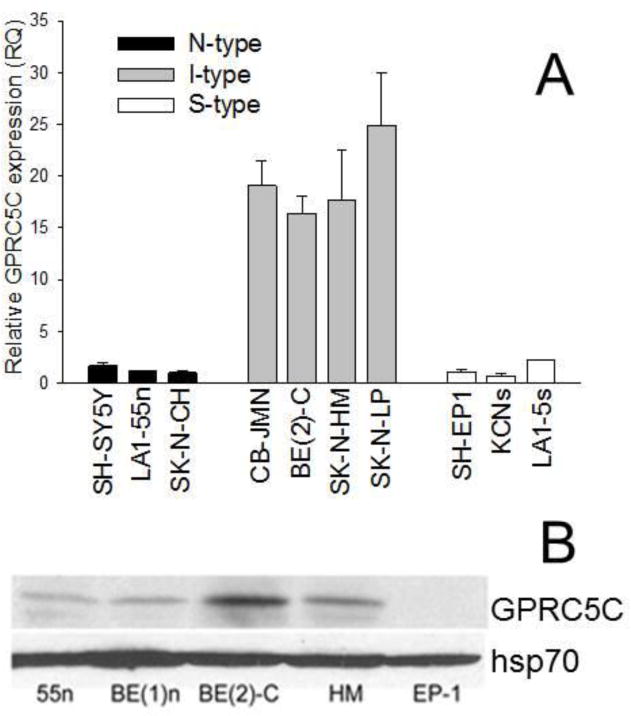
Figure 3.

Differential mRNA expression and protein amounts of GPRC5C in human neuroblastoma cell variants. A. GPRC5C mRNA levels. Each bar represents the mean ± SEM of 4–6 separate determinations. B. Representative western blot of GPRC5C and hsp70. Note that that the protein levels are significantly higher in the two I type cell lines, BE(2)-C and HM, compared to either N-type lines, 55n and BE(1)n, or the EP-1 S cell line.
