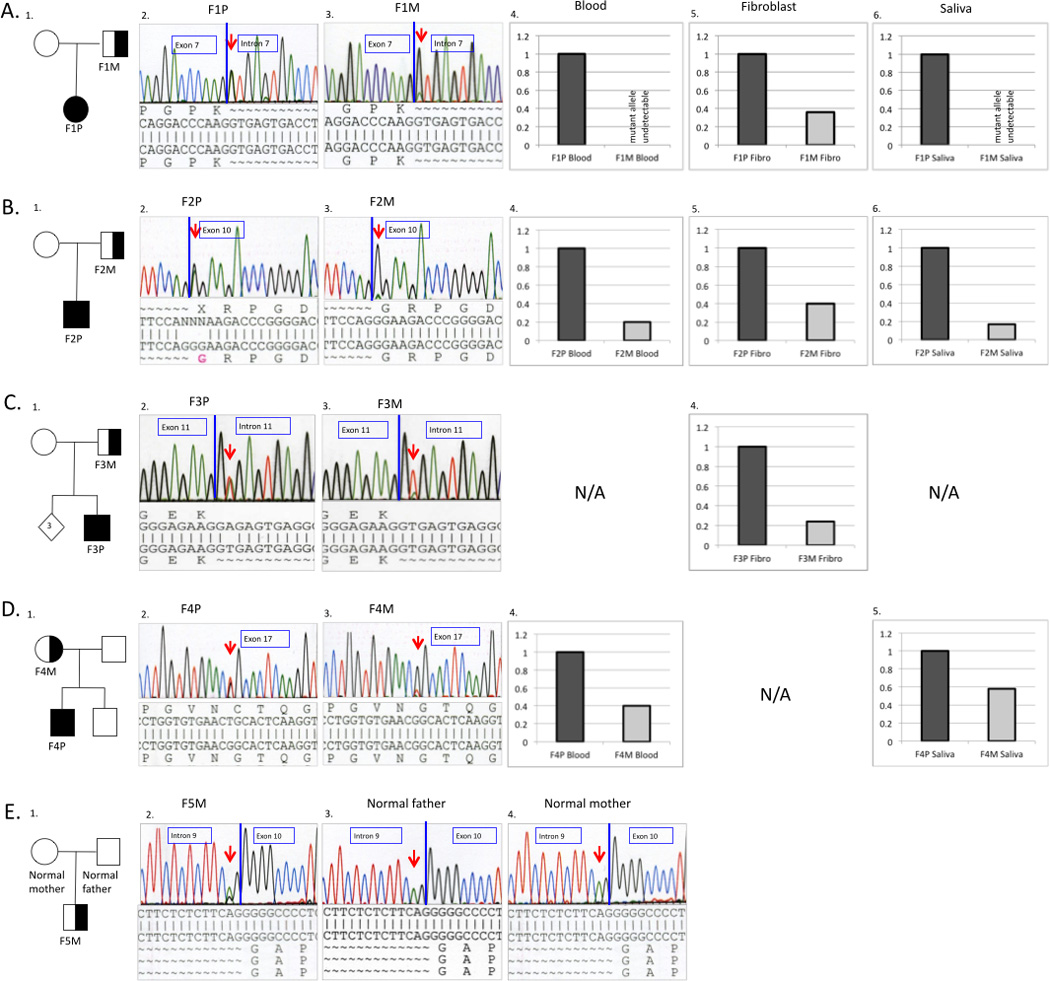
Figure 3.

Pedigrees and molecular characterizations of the respective families. Superscript numerals correspond to individuals in Table 1 (A-D). Genomic DNA sequence chromatograms show the somatic mutation in mosaic parent and affected child. Mutations were confirmed on RNA extracted from dermal fibroblasts for Family 1,2 and 3 and gDNA extracted from blood in Family 4 and 5. The mosaic mutation sequence is seen as a lower-height peak in the parent compared to the non-mosaic mutation in the child (A-D). (A): Sequencing results of Family 1 showing heterozygous COL6A2 c.900+1G>A mutation in the patient F1P (A2. left) and mosaic father F1M (A3. right). (B): Sequencing results of Family 2 showing heterozygous COL6A1 c.859G>A (p.Gly287Arg ) mutation in the affected son F2P (B2. left) and mosaic father F2P (B3. right). (C): Sequencing results of Family 3 showing heterozygous COL6A1 c.930+2T>A mutation in the affected child F3P (C2. left) and mosaic father F3M (C3. right) (D): Sequencing results of Family 4 showing heterozygous COL6A3 c.6238G>T (p.Gly2080Cys) mutation in affected child F4P (D2. left) and mosaic mother F4M (D3. right). (E): Sequencing results of family F5 showing a lower-height peak of COL6A2 c.955-2A>G mutation in the mosaic patient F5M (E2. left) compared to the normal parents (E3.; E4.). Quantitative analysis of mutant allele expression from different tissues for the respective families. The graphic represents the percentage of the mutant allele expression in the probands (dark grey) and somatic mosaic parent (light grey).
