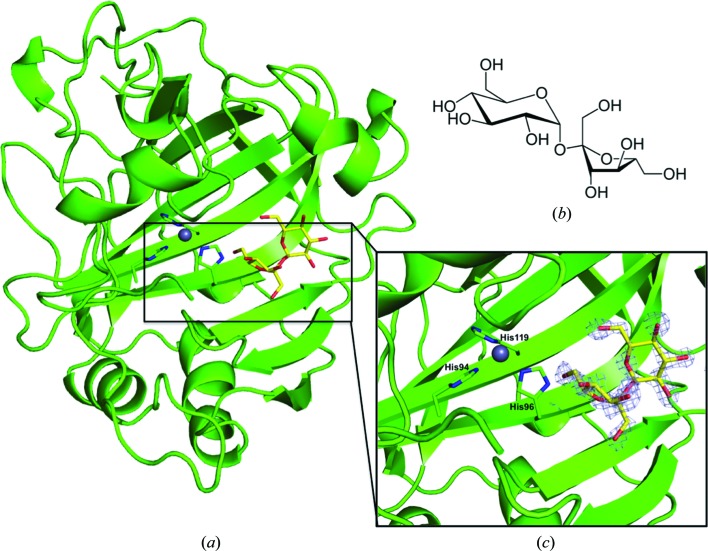
Figure 1.
(a) Cartoon representation of the CA IX mimic in complex with sucrose. The gray sphere coordinated by three histidine residues represents the zinc ion. The electron density (grey mesh; 2F o − F c Fourier map) is contoured at 1.3σ. (b) Structure of sucrose. (c) Enlarged view of the CA IX mimic–sucrose complex.

