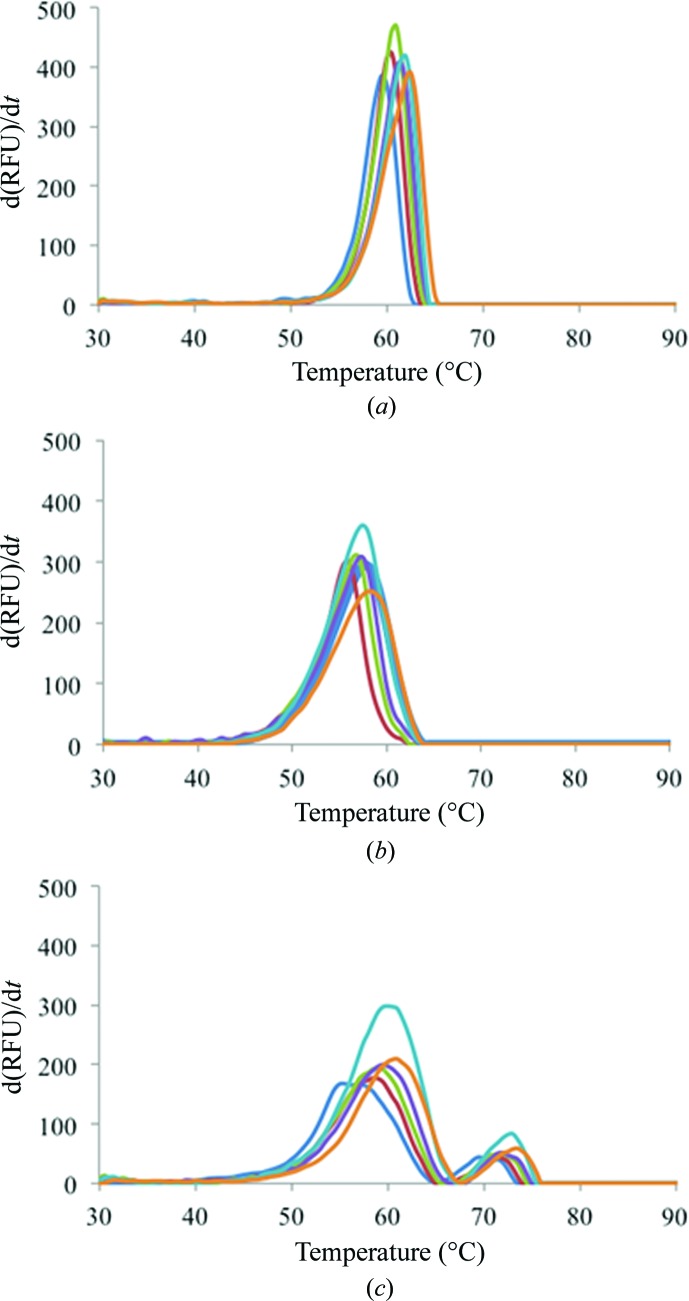
Figure 3.
DSF measurements of fluorescence intensity during heating of (a) CA II, (b) the CA IX mimic and (c) CA IX in the presence of varying concentrations of sucrose. For each isoform, the data are normalized averages from three temperature-scan experiments. Each color represents a scan carried out at a different sucrose concentration (blue, 0.0 M; red, 0.2 M; green, 0.4 M, purple, 0.6 M; cyan, 0.8 M; orange, 1.0 M).

