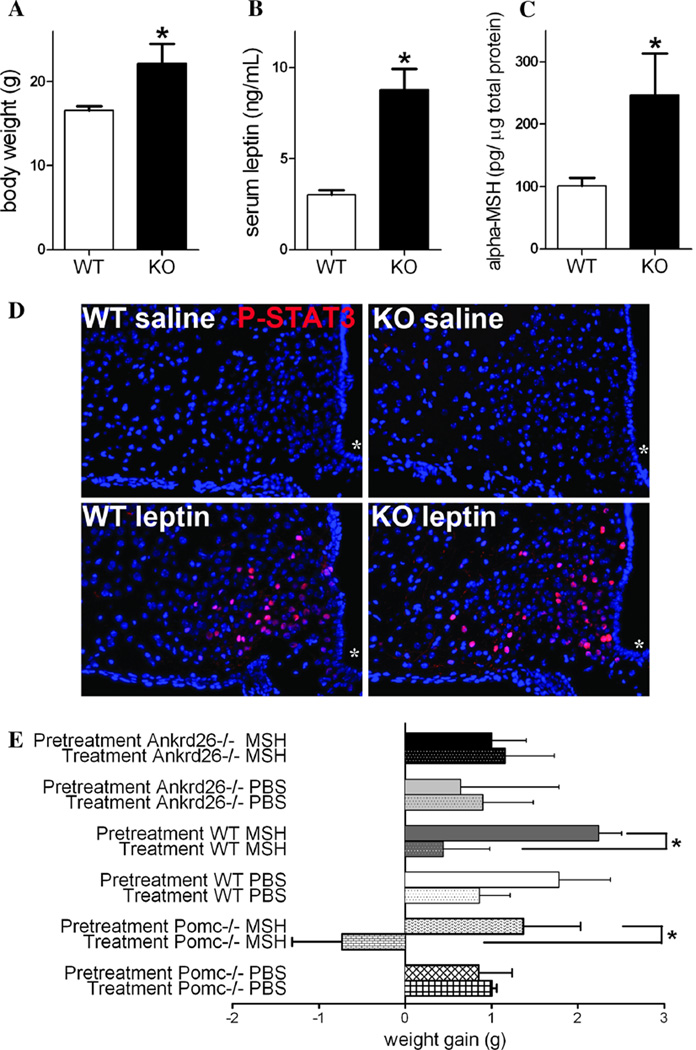
Fig. 5.
Characterization of the melanocortin pathway in Ankrd26−/− and WT mice. a– c Graphs show that at the age of 6 weeks, the significantly higher body weight of the Ankrd26−/− (KO) mice (a) is accompanied by significantly elevated serum leptin levels (b) and hypothalamic α-MSH concentration (c) as compared to the WT mice. Data are representative of 2 individual observations (n = 5 in each groups, from 2 different litters). Values are expressed as mean ± SEM. *p < 0.05. d IHC demonstrates nuclear labeling of phospho-STAT3 (red) in the ARC in leptintreated WT and Ankrd26−/− (KO) mice. Scale bar 100 µm. Asterisk indicates the third ventricle. e Effect of α-MSH treatment on the body weight of Ankrd26−/−, Pomc−/− and WT mice. Comparison of weight gain in experimental groups in the pretreatment period and during the α-MSH treatment is shown. The weight gain during the pretreatment and the α-MSH treatment period was significantly less in the WT than in the Ankrd26−/− mice. Pomc−/− mice lost body weight during α-MSH administration. Data are representative of 2 individual observations (n = 5 in each groups, from 2 different litters). For each experiment, values are expressed as mean ± SEM. *p < 0.05

