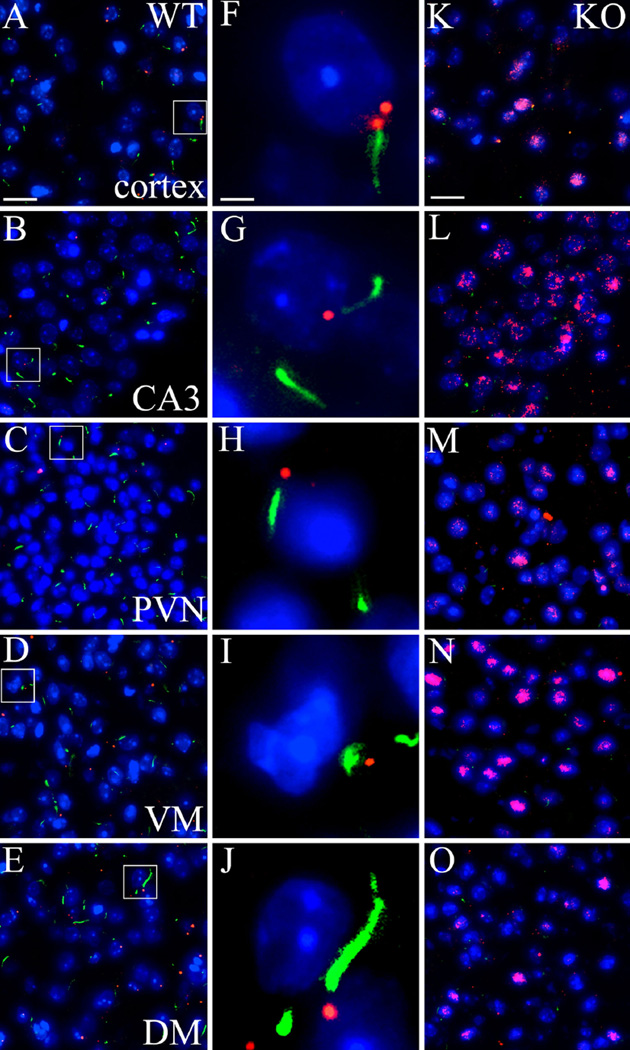
Fig. 7.
Expression and distribution of BBSome protein Bbs4 in the brain of Ankrd26−/− and WT mice. IHC demonstrates the expression and staining pattern of Bbs4 (red) and AC3 (green) in WT (a–j) and Ankrd26−/− (k–o) mice. The middle panel (f–j) displays representative cells from WT mice (white boxes in a–e). a, f, k represent the cortex, b, g, l the CA3 region of the hippocampus, c, h, m the PVN, d, i, n the VM and e, j, o the DM. Note the punctate staining of Bbs4 in the WT mice, the labeling is often localized to the base of AC3-positive primary cilia, as demonstrated in the middle panels (f–j). Bbs4 immunostaining in Ankrd26−/− mice shows a strong nuclear/perinuclear pattern in the indicated areas, accompanied by a significantly reduced number of AC3-positive primary cilia. Nuclei are visualized with DAPI (blue). Scale bar 15 µm in a and k, 2 µm in f. Images are representative of four independent observations (n = 3 in each group, four different litters)

