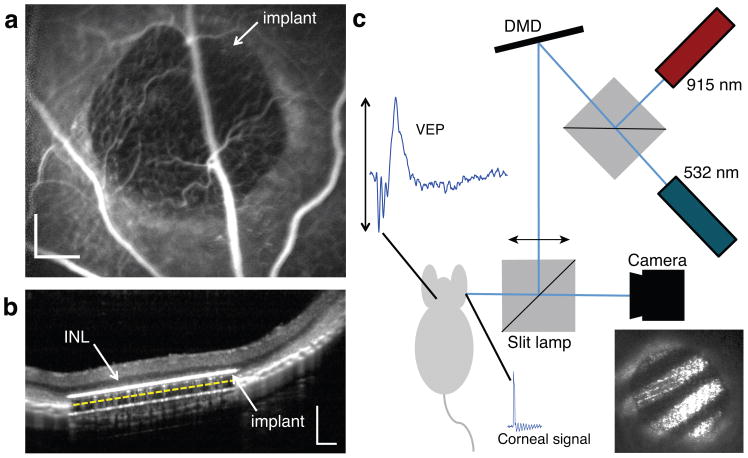
Figure 5. In-vivo subretinal implantation and stimulation setup.
(a) Fluorescein angiography one week after surgery demonstrates normal retinal blood perfusion above the implant with no leakage. The implant is opaque to visible light and masks the choroidal fluorescence in the implanted area. Scale bar: 200 μm. (b) OCT shows good preservation of the inner retina, with the inner nuclear layer (INL) located approximately 20μm above the upper surface of the implant (white line). The 30 μm implant appears thicker due to its high refractive index. The yellow dashed line illustrates the actual position of the back side of the implant on top of the RPE. Scale bar: 200 μm. (c) Stimulation system for VEP recordings. The visible (532 nm) and NIR (915 nm) lasers illuminate the DMD which generates the spatial patterns projected onto the retina, as shown in the photograph insert. The cortical activity (VEP signal) is recorded via transcranial electrodes simultaneously to the corneal potential, which reveals the stimulation pulses from the implant.

