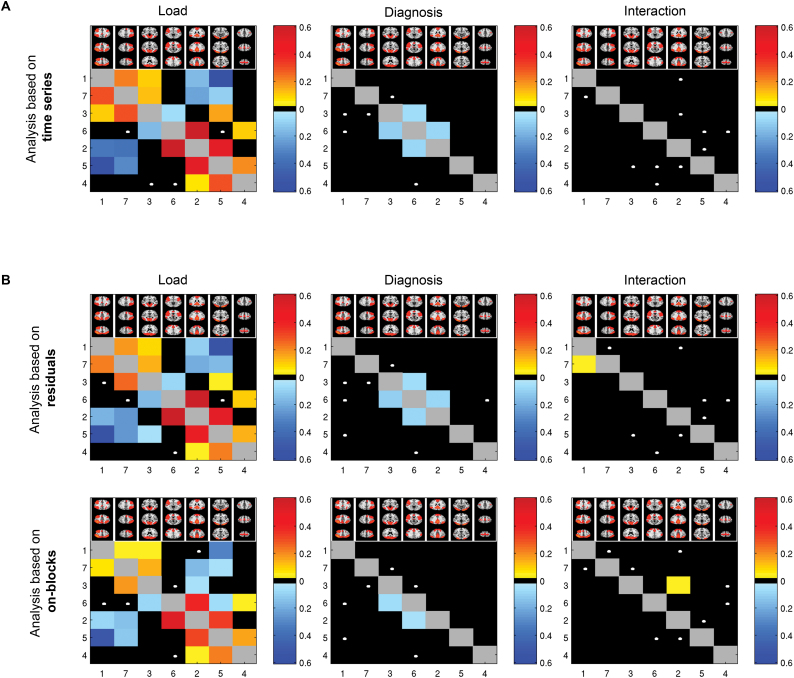
Fig. 2.
Effects of load, diagnosis, and their interactions on functional connectivity as revealed by (A) main analysis based on entire time series; (B) additional analyses based on residuals and experimental on-blocks only, yielding converging results across approaches. Numbers represent network numbers: (1) FP, (2) DMN, (3) VIS2, (4) MOT, (5) VIS1, (6) INS, and (7) LFP. Colors represent effect sizes (partial eta squared) for significant (P < .05, Bonferroni) correlations, where warm/cold colors represent increasing/decreasing connectivity, respectively, with increasing load. White dots show trend effects (nominal P < .05). Effects above the diagonal are based on partial correlations, while effects below the diagonal are based on full correlations.

