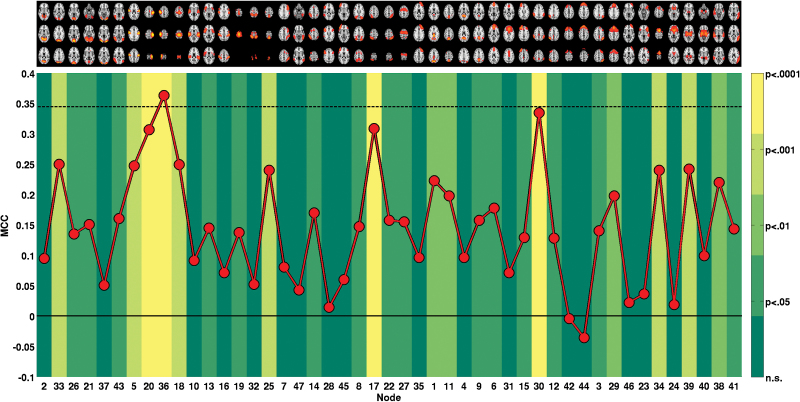
Fig. 2.
Classification based on the 46 edges of each single node. The red line depicts obtained Matthews correlation coefficient (MCC). The solid black line indicates chance level (MCC = 0) and the dashed black line indicates MCC level achieved with full set of features (all 1081 edges). The color in the background of each node indicates the level of significance obtained from 10000 permutation tests per node. For details, see supplementary table 6.

