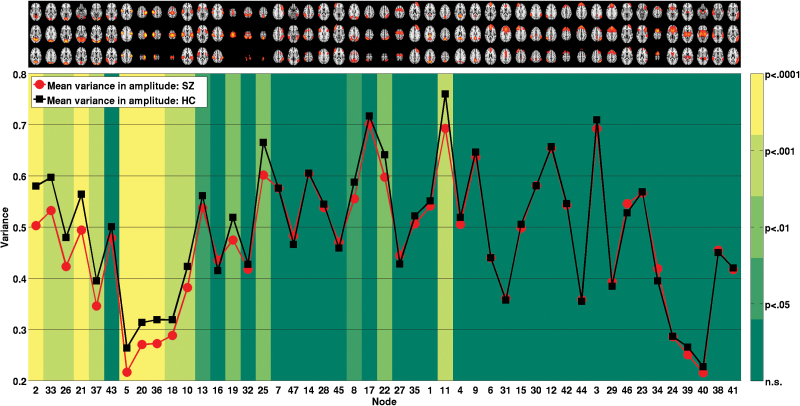
Fig. 3.
Comparison of mean standard deviation in signal amplitude. The red and black lines depict mean SD of time series within patients and controls, respectively. The color in the background of each node indicates the level of significance of an analysis of covariance testing for differences between schizophrenia and healthy controls while accounting for age and gender.

