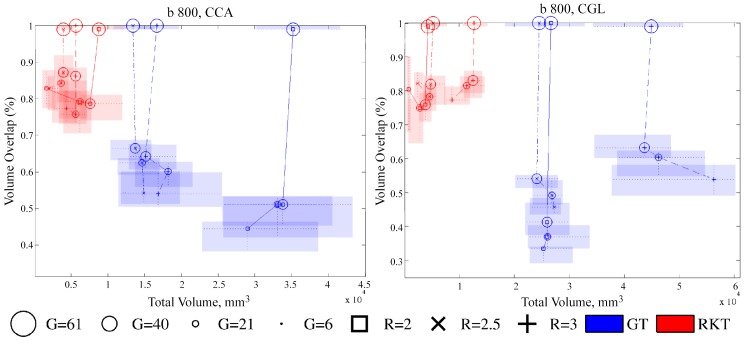
Fig 3. 2-D boxplot of Total Volume, , (mm 3) versus OV (percentage) for RKT (red) and GT (blue) on CCA and CGL fiber bundles at B = 800 s/mm 2, and different configurations of R and G.
The limits of each rectangle indicate the first and third quartile values for both boxplots. Dotted lines denote median values of each boxplot, while solid and dashed lines gather reconstructions that share the same voxel resolution.

