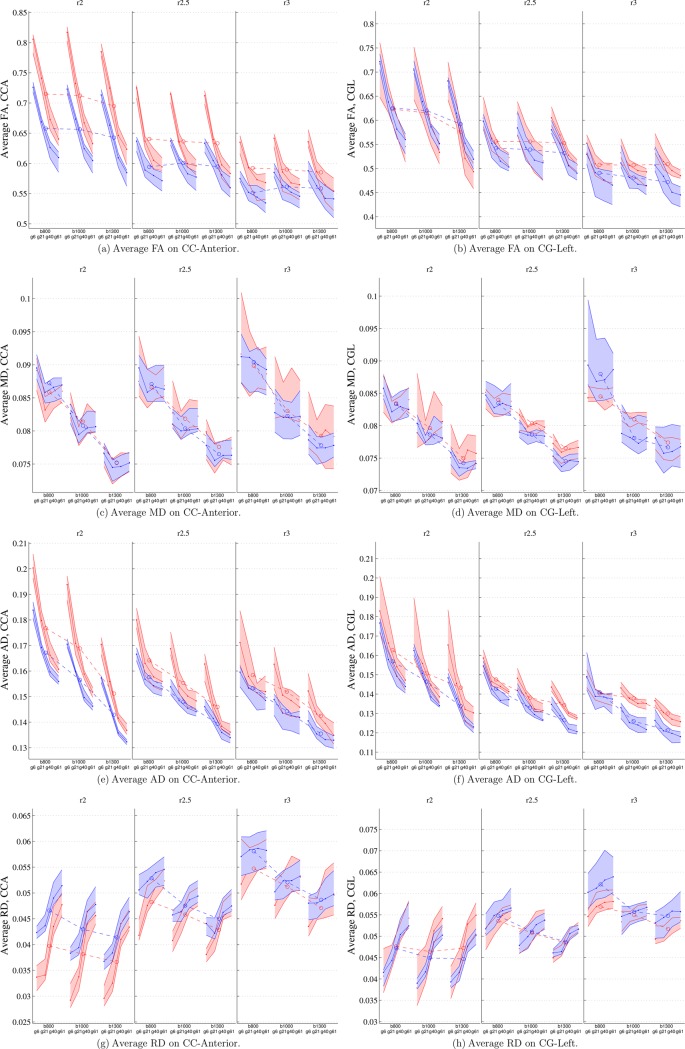
Fig 4. Average values for RKT(red) and GT(blue) on CCA(left column) and CGL (right column) for FA, MD, AD and RD.
Central lines represent median values; upper and lower lines of the shaded areas represent the first and third quartile of the data. Dashed lines between groups represent average values of each group.

