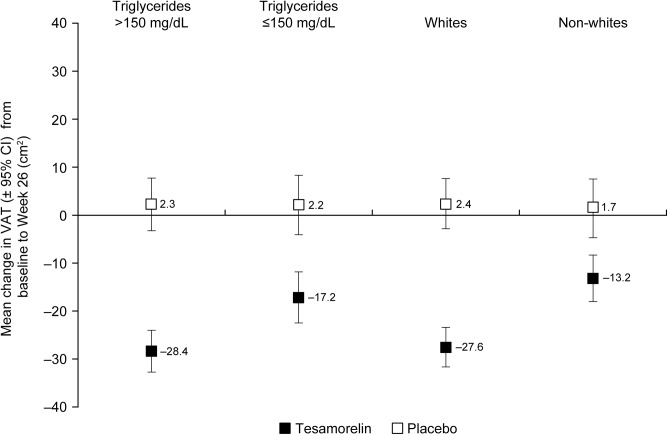
Fig 2. Mean change from baseline to 6 months by race and baseline triglyceride levels.
The difference in mean absolute change in VAT from baseline to 6 months for tesamorelin versus placebo was greater for patients with triglycerides > 1.7 mmol/L than for those with triglycerides ≤ 1.7 mmol/L (interaction p = 0.063), and greater for white patients compared with non-white patients (interaction p = 0.025).

