Figure 1.

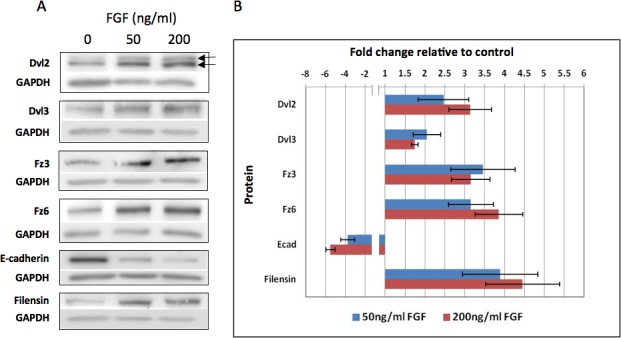
FGF upregulates Wnt-Fz signaling components as most cells switch from epithelial to fiber phenotype. (A) Western blots show that Dvl2, Dvl3, Fz3, and Fz6 are all upregulated in explants after 4 days exposure to either 50 or 200 ng/mL FGF-2. Dvl2 is present in two bands (arrows); the upper band being the phosphorylated form of Dvl2. Expression of the fiber-specific intermediate filament filensin is also upregulated in the FGF-treated explants. E-cadherin, the epithelial marker, is downregulated. (B) The histogram shows band density measurements at the two concentrations of FGF-2. In the case of Dvl2, total levels are presented (i.e., summation of upper and lower bands). In all cases, GAPDH loading controls were used to normalize the levels of protein detected and the results were presented as fold changes relative to the respective controls. Data presented shows the mean ± SEM (n = 4). Both Dvls and Fzs showed significant 2- to 4-fold increases in expression relative to controls at both concentrations of FGF. Dvl2 was the only signaling component that showed a significant (P = ≤ 0.05, 2-tailed t-test) concentration-related effect. For Dvl2, although both bands showed increased density, the observation that the upper phosphorylated (active Dvl2) band was significantly increased (P = ≤ 0.05) in the presence of FGF indicates that Wnt-Fz signaling is enhanced by FGF (see Supplementary Material and Supplementary Table, http://www.iovs.org/content/54/3/1582/suppl/DC1). For E-cadherin, the band density was substantially reduced by both concentrations of FGF. In the case of Dvl3, Fz3, Fz6, Filensin and E-cadherin both 50 ng/mL and 200 ng/mL showed significant difference compared to control (P = ≤ 0.05, 2-tailed t-test).
