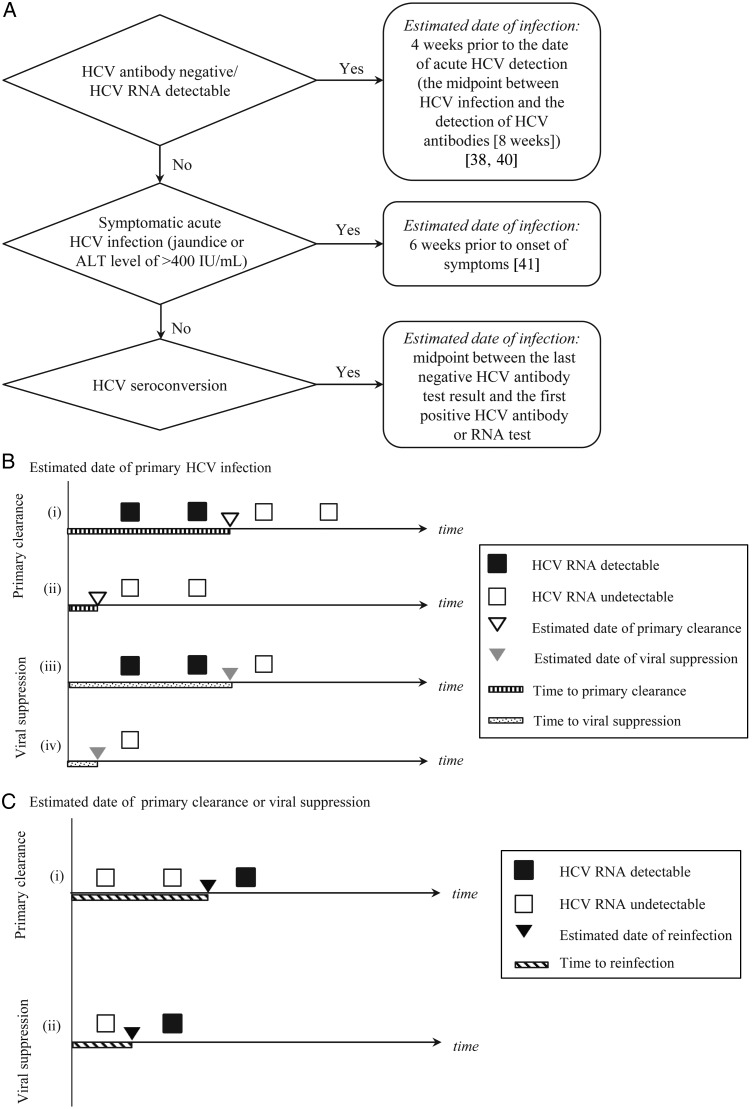
Figure 1.
Timing and classification of hepatitis C virus (HCV) primary infection, viral suppression, spontaneous clearance, and reinfection. A, Flowchart for determining the estimated date of primary HCV infection. B, Estimated dates of and times to primary clearance and viral suppression. All timelines represent participants with confirmed primary HCV infection followed by either viral suppression or primary clearance. The timelines begin at the estimated date of primary infection. After primary infection, HCV RNA test results are depicted on the timeline by squares. Black squares represent HCV RNA–positive test results, and white squares represent HCV RNA–negative test results. Primary clearance is distinguished from viral suppression by the number of HCV RNA–negative test results (white squares). The top timelines (i and ii) depict primary clearance (as indicated by the 2 consecutive HCV RNA–negative test results), and the bottom timelines (iii and iv) depict viral suppression (defined as 1 HCV RNA–negative test result). In timelines ii and iv, HCV RNA was undetectable at the time of primary infection detection, as indicated by the white initial squares (HCV RNA tests) in the timelines. The estimated date of primary clearance is illustrated using a white triangle, and the estimated date of viral suppression is illustrated using a gray triangle. These dates are both estimated as follows: if HCV RNA is detectable at the time of detection of primary infection (i and iii), the estimated date of primary clearance or viral suppression is the midpoint between the HCV RNA–positive test result prior to primary clearance or viral suppression and the first HCV RNA–negative test result.

