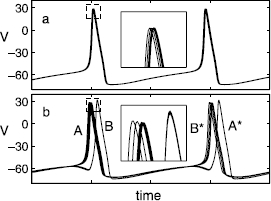
Fig. 1.

Time series of the membrane potentials ( ’s) of 10 heterogeneous neurons characterized by slightly different synaptic relaxation time constants
  in Eq. (3); ω is uniformly distributed in
  and
and  . a Single-cluster state where the entire network oscillates synchronously (
 ). b Double-cluster state (
 ), whose period is approximately twice that of the orbit in panel a, where sub-networks of four and six neurons form two synchronously oscillating clusters, with a phase lag between them. Insets are blow-ups of the region at the peak of the action potential oscillations, marked by dashed boxes. In the double-cluster state in b, the cluster which “spikes first” on one cycle (denoted by A; consisting of six neurons) “spikes second” on the following cycle (A*), giving the solution its “period-2” nature (B and B* are the same group of four neurons at different time)
