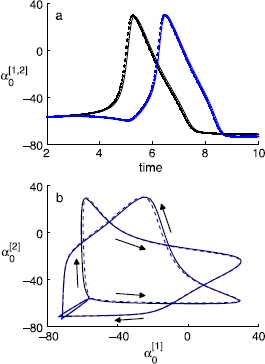
Fig. 10.

Coarse projective integration of double-cluster states (dotted lines in blue and black colors), compared against the direct full integration (solid lines in the same colors). Both projective integrations are performed with a fixed step size of 0.001; after five healing steps, three such steps during a short direct integration are used to estimate time derivatives, with a forward Euler jump of 20 steps. a The blow-up of the temporal trajectory of  for V (the average membrane potential) of two clusters, during a fraction of the period, where the two clusters reach the peak potential successively. b The
  for V of one cluster against that of the other cluster, during a cycle of a double-cluster state (
 , with the standard deviation
  is 0.05). Arrows indicate the direction of the evolution over time
