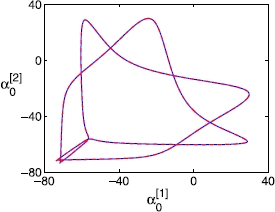
Fig. 11.

Limit cycles of a double-cluster state calculated with a coarse-grained fixed point algorithm for 100 neurons, plotted in terms of the first order PC coefficient  (for V) of one cluster against that of the other cluster (
 ). A normal distribution of ω is considered, with a standard deviation of 0.01 and
  . The solid line (blue) corresponds to the full integration, and the dashed line (red), which overlays the solid one, corresponds to what is obtained by the coarse fixed point algorithm. Note that these two solutions are visually indistinguishable
