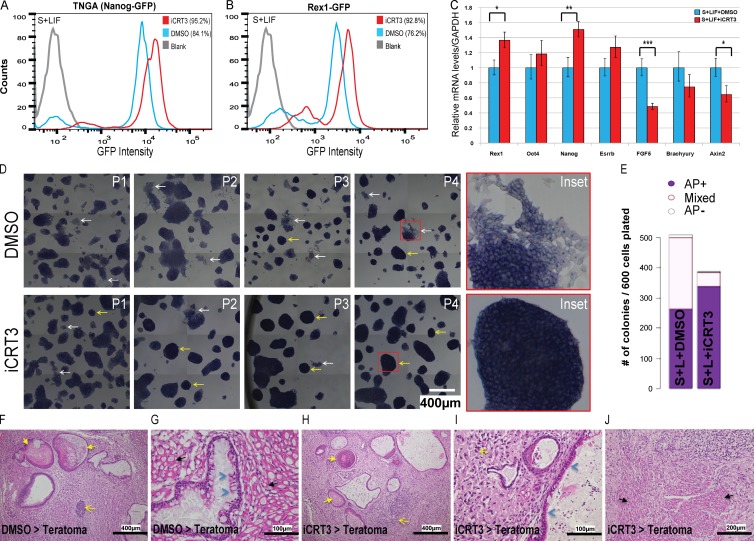
Figure 2.
Long-term inhibition of β-catenin/TCF–mediated transcriptional activity enhances self-renewal of mESCs. (A and B) Flow cytometry of TNGA (Nanog reporter) (A) and Rex1-GFP (B) mESCs grown in serum plus LIF (S+LIF) with iCRT3 (14 d). Two independent experiments were set up with TNGA and Rex1-GFP cell lines. (C) qPCR analysis for pluripotency/differentiation markers and TCF target genes in cells maintained in iCRT3 for four passages. Mean ± SD of three replicates. (D) Representative bright-field images of mESCs maintained in S+LIF over multiple passages of iCRT3 treatment (P1–P4). Note that iCRT3-treated cells demonstrate lower spontaneous differentiation (white arrows and inset), more compact colony morphology, and higher AP expression (yellow arrows and inset), compared with DMSO. Resized original images and additional ×6 digitally magnified insets shown are from a single representative experiment (for NG4) out of three replicates for each of NG4 and Rex1-GFP cell lines. (E) Representative quantification of AP levels of colonies formed from E14Tg2A mESCs after iCRT3 treatment in stem conditions (S+LIF).These results are representative of identical experiments set up for two independent E14Tg2A and CBA cell lines. (F–J) Representative staining of teratomas derived from NG4 cells treated with DMSO (F and G) or iCRT3 (H–J). Detection of tissue derived from all three germ layers is suggestive of teratoma arising from pluripotent cells and is marked by keratin in lumen of cysts lined by squamous keratinized epithelium (ectoderm, yellow arrows), neoplastic neuronal tissue/neuron rosettes (ectoderm, yellow open arrows), cysts lined by single layer of cuboidal or pseudostratified columnar ciliated epithelium (endoderm, blue arrowheads), and skeletal muscles (mesoderm, black arrows). Resized original images provided by IMCB Histopathology Core (A*Star) are from a single representative experiment out of eight pairs of teratomas generated from cells treated with DMSO/iCRT3 for 14 d. Refer to Fig. S1 F for representative immunofluorescence staining of germ layer markers in teratoma generated from iCRT3-treated cells. *, P < 0.05; **, P < 0.01; ***, P < 0.001.

