Figure 1.
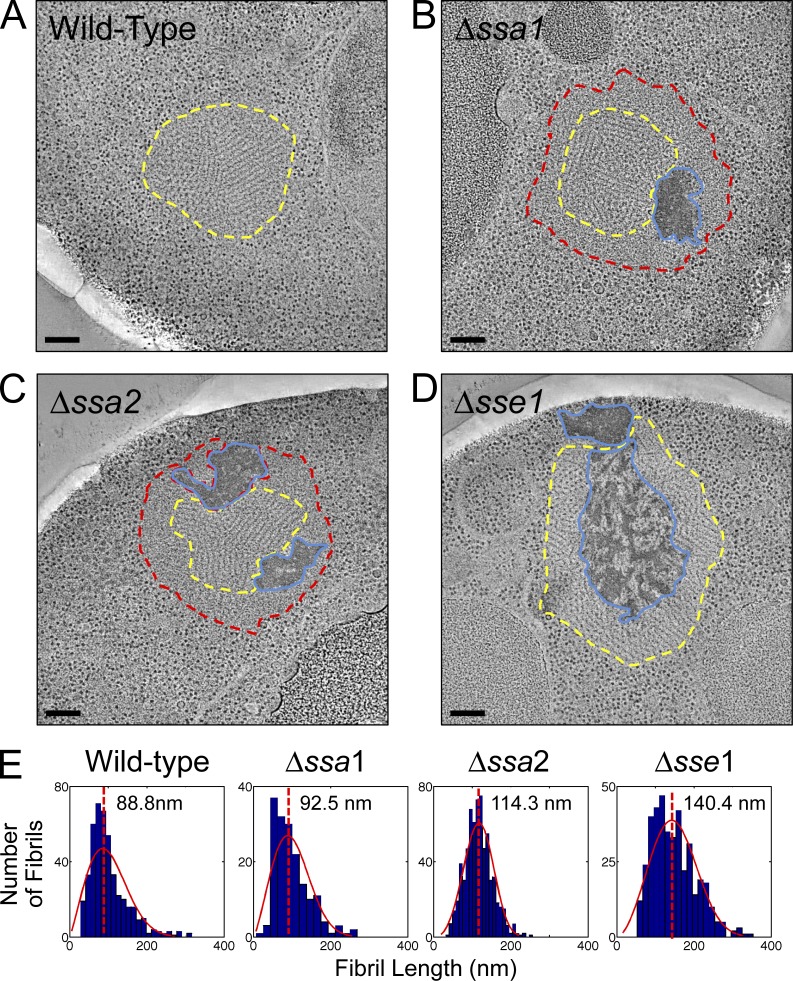
Aggregate remodeling in chaperone knockout strains. Representative tomographic slices through reconstructions of NM-YFP dots in HM20-embedded cell sections from cells with a wild-type chaperone complement and those with Δssa1, Δssa2, and Δsse1 deletions, as indicated. Fibril-containing regions are outlined in yellow, unstructured perimeter zones are outlined in red, and dark amorphous aggregates are outlined in blue. These structures were visible in 100% of the aggregates of each respective strain and were from at least 20 independent NM-YFP dot observations (tomograms and projections). Bars, 200 nm. (A) Wild-type chaperone complement. The yellow outline around the fibril aggregate was manually traced by following the interface between the fibrils and the cytosolic ribosomes. (B) Δssa1. The yellow outline around the fibrils was manually traced at the interface between the fibrils and the unstructured peripheral layer. The red outline was traced at the interface between the unstructured zone and the cytosolic ribosomes. The blue outline was drawn around the perimeter of the dark amorphous material. (C) Δssa2. The red, yellow, and blue outlines were defined as in B. (D) Δsse1. The yellow outline was defined as in A and the blue outline was defined as in B. (E) Distribution plots of individual fibril lengths in tomograms of NM-YFP aggregates from wild-type, Δssa1, Δssa2, and Δsse1 cells. Fibrils were measured in at least three independent dot assemblies for each strain. The total number of fibrils was 450 for the wild type, 171 for Δssa1, 668 for Δssa2, and 407 for the Δsse1 aggregates. For each histogram, the number of bins was equal to the square root of the number of elements in the data set. A Weibull distribution was calculated for the data and plotted with each histogram.

