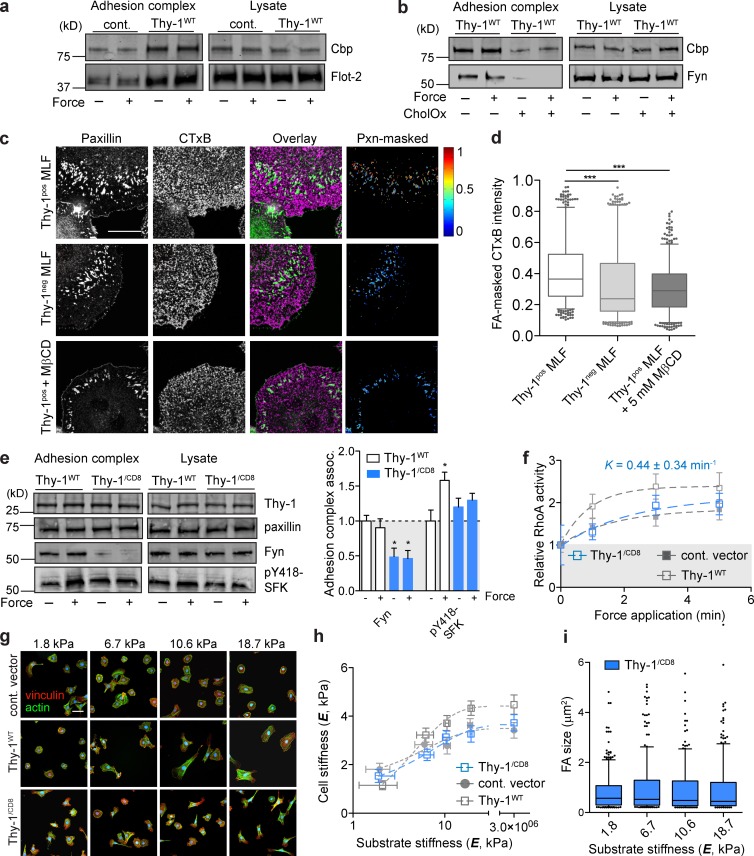
Figure 3.
Membrane raft recruitment to FAs is facilitated by Thy-1 and participates in rigidity sensing. (a) Immunoblots of proteins associated with adhesion complex or total lysate before (− force) or after (+ force) 3-min force application in control vector and Thy-1WT RFL-6 cells. (b) Immunoblots as in (a) with or without 1 U/ml CholOx Thy-1WT RFL-6 cells. (c) Fluorescence images of MLFs on FN-coated glass (FN-gl) stained for paxillin (pxn) and membrane raft marker GM1 (CTxB), and FA (pxn)–masked CTxB intensity images are shown; the range of intensity values (arbitrary units) is indicated by heat scale. Bar, 50 µm. (d) Intensity of CTxB was quantified within paxillin-masked FAs (>2,500 FAs pooled for n = 10–12 individual cells per group) for MLFs subpopulations and Thy1pos treated with 5 mM MβCD. Significance was calculated using the Kruskal-Wallis nonparametric test with Dunn’s multiple comparisons. (e) Immunoblots of proteins associated with FN beads before (− force) or after (+ force) 3 min of constant force application or total cell lysates in Thy-1WT and Thy-1/CD8 RFL-6 cells. Averages of n = 3 independent experiments for association with FN-bead adhesion complexes before (− force) or after 3-min force application (+ force). Significance was calculated between all groups for individual adhesion components using one-way analysis of variance and Tukey’s post test. (f) Activation of RhoA after magnetic force stimulation of FN beads for the indicated time periods in Thy-1/CD8 RFL-6 cells (n = 5). Apparent rate constant (K) for a single-phase association model is indicated. Immunostaining for FAs and F-actin (g), single-cell cortical stiffness measurements (h), and FA quantification (i) of RFL-6 cells on FN-PA substrates of varying stiffness. Bar, 50 µm. *, P < 0.05; ***, P < 0.001 between indicated groups.

