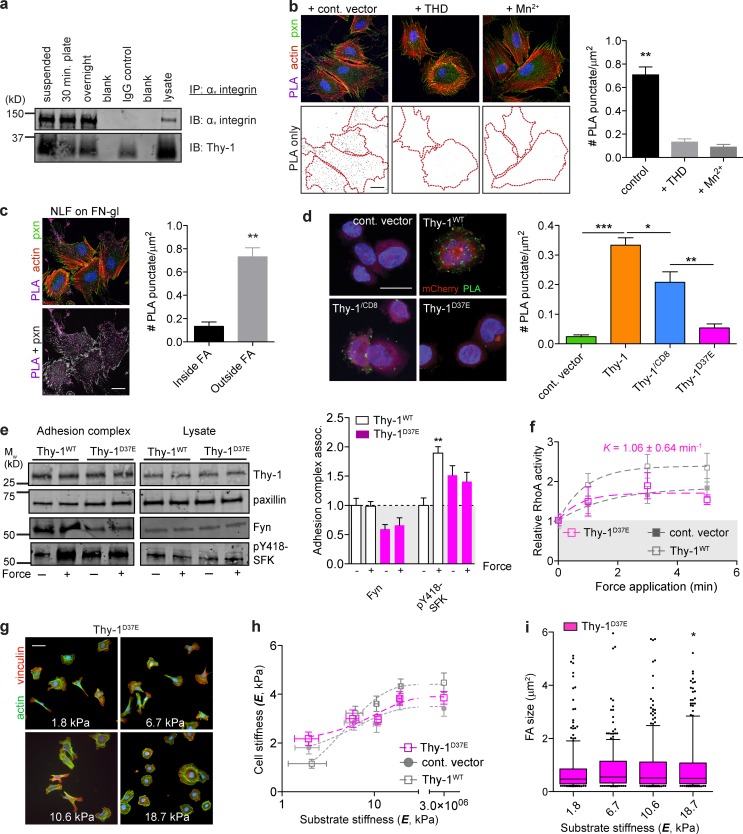
Figure 4.
Thy-1 binds inactive αvβ3 and is required for membrane raft recruitment to FAs, mechanosignaling, and rigidity sensing. (a) αv integrin was immunoprecipitated from human NLFs in suspension versus spread on FN for 30 min or overnight, and αv and Thy-1 were immunoblotted. (b) Micrographs of PLA between αvβ3 (mAb 23C6) and Thy-1, pxn immunostaining, and F-actin in NLFs treated with nonbinding control talin (1–405)A/E (cont. vector), wild-type THD (1–405), or 2 mM Mn2+ integrin activating conditions. Quantification of PLA cell surface density (mean ± SEM). Bar, 20 µm. (c) PLA signals were masked with pxn immunostaining and the surface density of PLA was segregated into inside versus outside FAs regions and quantified. Bar, 20 µm. (d) Quantification of PLA cell surface density in CHO.B2(hαvβ3) expressing human Thy-1WT, Thy-1/CD8, and Thy-1D37E. PLA puncta, mCherry (transfection control), and cell nuclei are shown. Bar, 20 µm. (e) Immunoblots of proteins associated with adhesion complex or total lysate before (− force) or after (+ force) 3 min force application in Thy-1WT and Thy-1D37E RFL-6 cells. Averages of n = 3 independent experiments for association with FN-bead adhesion complexes before (− force) or after 3 min force application (+ force) were quantified. Significance was calculated between all groups for individual adhesion components. (f) Activation of RhoA after magnetic force stimulation of FN beads for the indicated time periods in Thy-1D37E RFL-6 cells. Apparent rate constant (K) for a single-phase association model is indicated; plateau phase of Thy-1D37E was statistically different from Thy-1WT (n = 5; unpaired t test, P < 0.05). Immunostaining for FAs and F-actin (g), single-cell cortical stiffness measurements (h), and FA size (i) of Thy-1D37E RFL-6 cells on FN-PA substrates of varying stiffness. Bar, 50 µm. Statistical significance was calculated using Kruskal-Wallis nonparametric test with Dunn’s multiple comparison. All other statistical significance was calculated using one-way analysis of variance and Tukey’s post test. *, P < 0.05; **, P < 0.01; ***, P < 0.001 between indicated groups.

