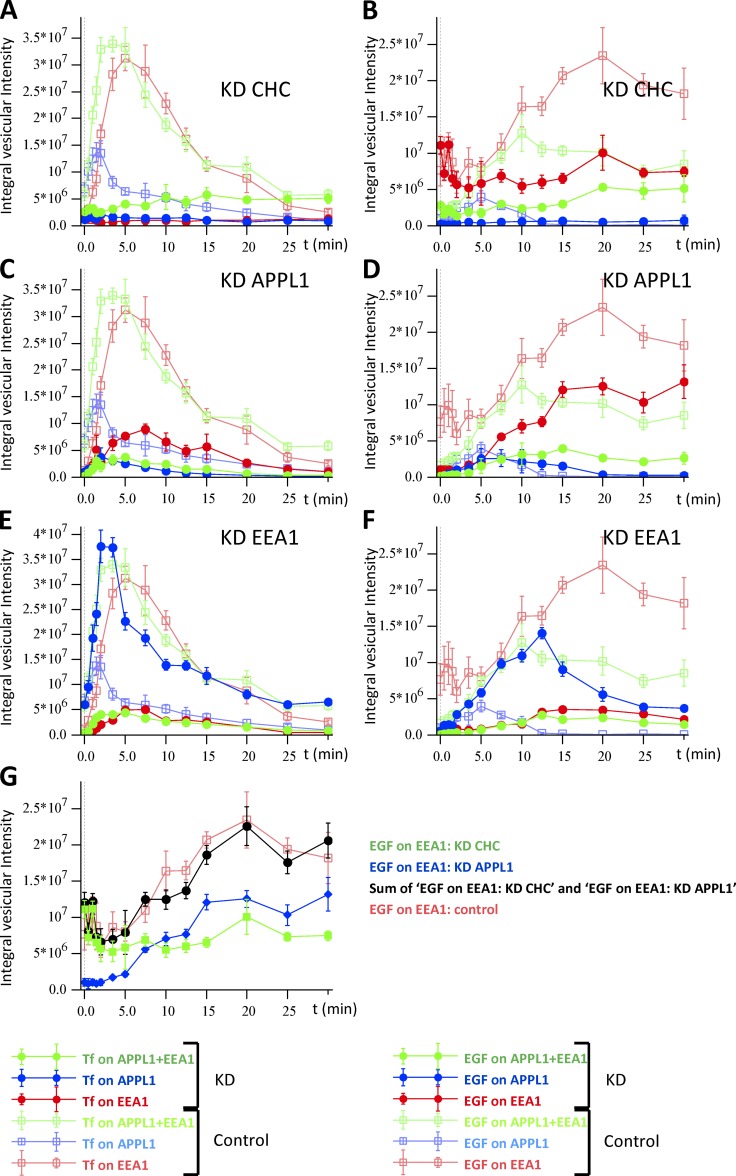
Figure 7.
Time course of Tf (A, C, and E) and EGF (B, D, and F) distribution in EEA1- and APPL1-positive structures under down-regulation of CHC, APPL1, and EEA1. Cells were transfected by siRNA for CHC (A and B), APPL1 (C and D) and EEA1 (E and F) for 48 h (see Materials and methods). Then fluorescently labeled Tf and EGF were internalized and chased as described in Fig. 6. Solid circles present the integral intensity of cargo colocalized with EEA1- (red), APPL1- (blue), and double APPL1+EEA1–positive endosomes (green). The control curves are presented by empty squares. Down-regulation of CHC, APPL1, and EEA1 was 95%, 70%, and 90%, respectively. Traffic of cargo in the control condition is repeatedly presented on panels A–F by empty squares. (G) Integral intensity of EGF colocalized with EEA1 under CHC knockdown (green) and APPL1 knockdown (blue). Sum of blue and green curves (sum of integral intensities of EGF colocalized with EEA1 upon APPL1 or CHC knockdown) is plotted by solid black circles. The time course of integral intensities of EGF colocalized with EEA1 for control is plotted by red squares.

