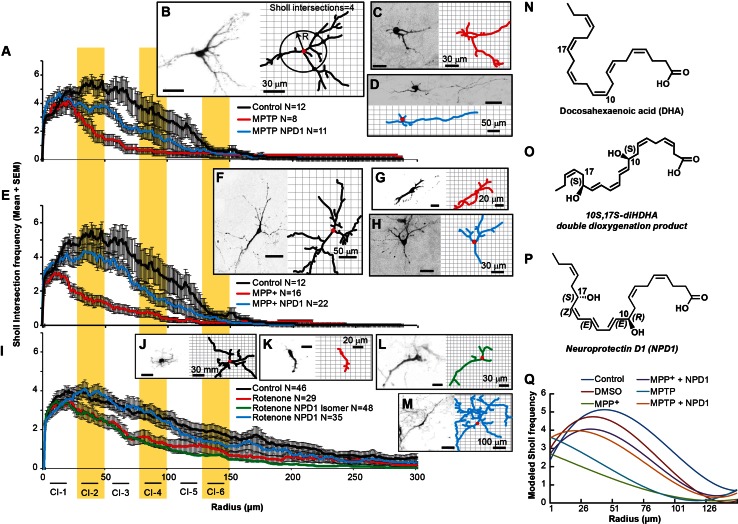
Fig. 2.
NPD1 prevents disruption of dendritic architecture caused by MPP+, MPTP, or rotenone. The dendritic architecture was assessed using Sholl analysis, which involves calculating the frequency at which the dendritic arbor intersects a series of concentric circles separated by 1 µm using the soma as the center (b right panel). a, e Sholl number of intersections (averaged) versus radius of neurons treated with a MPTP, e MPP+ and i rotenone in the presence or absence of NPD1. In all cases, comparisons were made against non-treated neurons (control). The curves were fitted to a polynomial regression model using a least squares regression model (P < 0.0001); see Supplementary Tables 1–5 and Supplementary Fig. 4. b–d, f–m Right and left panels show a neuron and its corresponding tracings as an output of the IMARIS software, respectively. b, f, j Control neurons or treated with c, d 100 µm MPTP; g, h 100 µm MPP+; k–m rotenone 100 nM; d, h, m plus of NPD1 or l its S–S stereoisomer. The values are represented as the mean ± SEM. NS non-significant P value. n, o Molecular structure of n DHA; o 10S-17S-diHDHAstereoisomer and p NPD1. q Polynomial regression model for MPP+ and MPTP Sholl intersections. The mathematical formulas for the curves plotted are described in Supplementary Table 1. Isomer: 10S,17S-diHDHA

