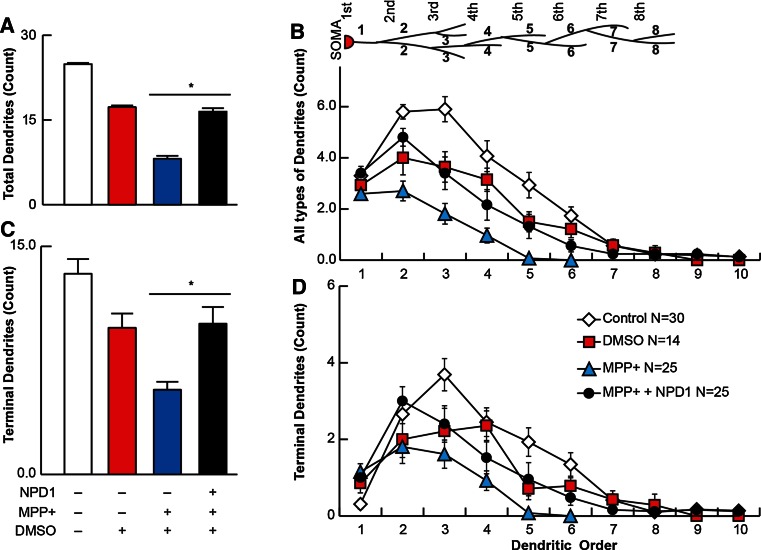
Fig. 3.
Terminal dendrites are preserved with NPD1 treatment. TH-positive neurons were traced using a NeuronJ plug-in of ImageJ. a, c Average of the dendritic order. b, d Average of segments for each dendritic order (a, b) and terminal dendrites (c, d) in control, DMSO- or MPP+-treated cells, the latter in the presence or absence of NPD1. The values are represented as the mean ± SEM. *P < 0.05. NS non-significant P value

