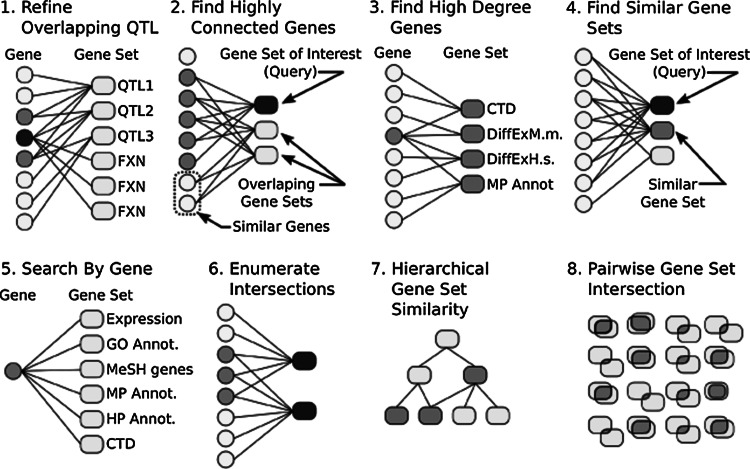
Fig. 2.
Biological applications of the GeneWeaver bipartite graph representation. A bipartite graph consists of two partite sets of vertices, with edges between but not within each partite set. A GeneWeaver collection of gene sets consists of one such partite set of vertices representing gene set identifiers and the other partite set representing the genes contained in all the gene sets. Edges between a gene set and genes define gene set membership. This discrete mathematical structure makes possible an efficient application of specialized graph algorithms for rapid comparisons among large numbers of gene sets. (1) To refine overlapping QTL and prioritize functional candidates using trait-relevant data, positional candidates for each locus are entered as gene lists (QTL1-3) and compared to genomic studies of related traits (FXNs). Genes within overlapping QTL are represented in gray, a functionally relevant shared candidate is indicated in black. (2) The ABBA tool is used to find similar genes based on a guilt-by-association-type transitive inference. A gene set of interest is entered into ABBA. Gene sets that overlap the input set either directly or through gene homology among the elements of the sets are retrieved (blue oval nodes). Genes and homologs which are highly similar to the input set based on shared connectivity are retrieved. (3) Highly connected (i.e., high degree) genes are found using the gene set graph tool. A group of gene sets are selected from user uploads or search results. The Gene Set graph represents the most highly connected genes with a user-defined threshold for minimum degree (number of edges) from each gene. The highest degree genes are forced to the right of the plot (although not shown here). (4) To find similar gene sets, users calculate the Jaccard similarity of each gene set in the database to a single user-selected gene set. Results are presented in a ranked table. (5) Entering a single gene identifier in the search box generates a list of gene sets containing the query gene or any homolog or identifier match to the gene. (6) To find the gene elements in the intersection of gene sets, users select a Jaccard similarity value from any table or matrix. (7) The Hierarchical Gene Set Similarity Graph represents successively higher order intersections in a directed acyclic graph, such that individual lists are at the leaves of the graphs and two-way, three-way…n-way intersections are represented on increasingly higher levels of the graph. Shading represents nodes that contain members of a user-selected set of ‘emphasis genes.’ (8) Pairwise gene set intersections are analyzed using the ‘Jaccard similarity’ or ‘Hypergeometric test’ tools. The positive matches (intersection) are compared to the set of possible matches for each pair of gene sets (Color figure online)

