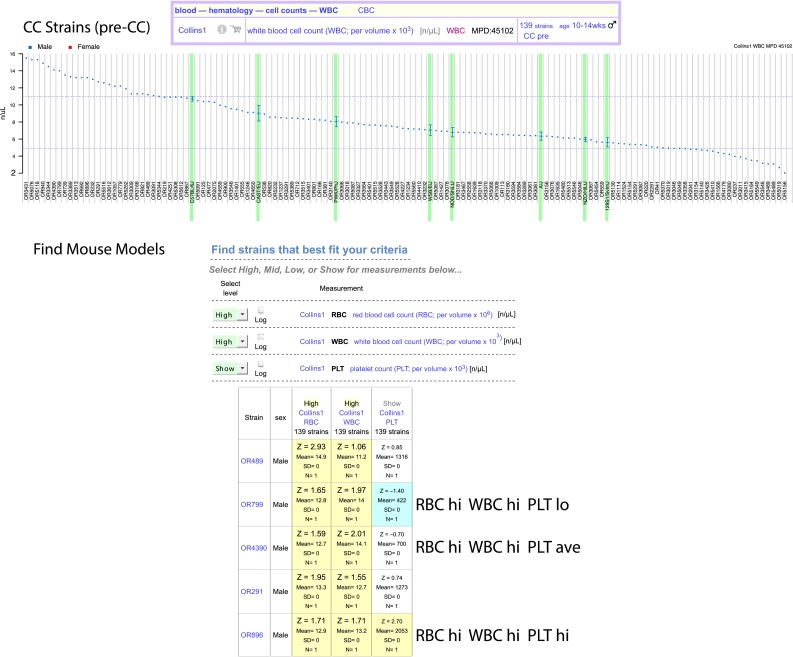
Fig. 4.

CC Strains. Data for CC strains can be viewed in a measurement plot as shown in the upper panel for white blood cell count (WBC), where strains are along the x-axis and WBC is on the y-axis. In this example, only males were tested (blue). There are options for plotting these results as well as output options (here we chose eps). The lower panel illustrates the criteria-fit tool. In this example, we wanted to identify CC strains with high red blood cell count (RBC) and high WBC, but with a wide range of values for platelet count (PLT). We first selected our measurements of interest (this step not shown) and applied the tool. Then we selected “High,” “Mid,” “Low,” or “Show” for each measurement according to our criteria. Results (truncated) are shown in a screenshot where high-end outliers are in yellow and low-end outliers are in blue. These blood cell parameters are from MPD project Collins1 (Collins 2012; Kelada et al. 2012)
