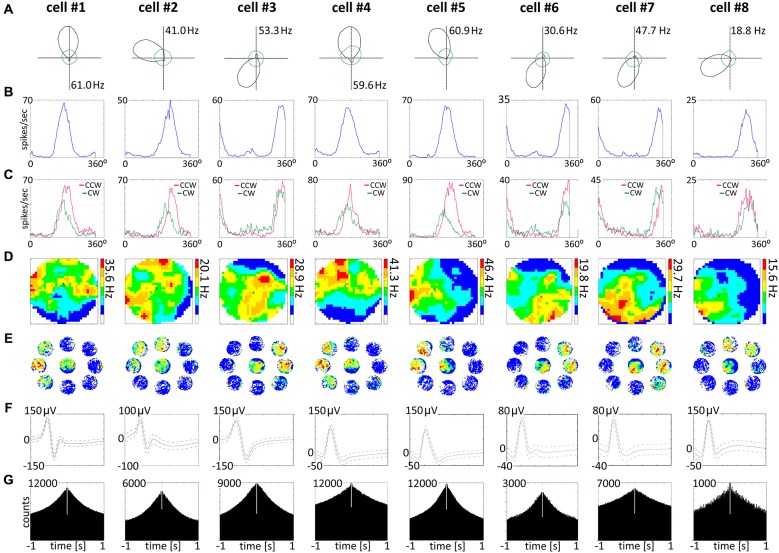
Figure 6.
Head direction cells recorded in the AM of the thalamus. (A) Head direction cells with consecutive numbers are presented in columns 1–8. For each unit, data recorded during the whole 20-min sessions are presented. (A) Polar plots. (B) Tuning curves. (C) Tuning curves for clockwise and counter-clockwise movement of the rat, showing the separation angle observed in examples of recorded head direction cells. (D) Firing intensity maps. (E) Spatial analysis conducted for cardinal orientations showing no effect of spatial position on unit activity. (F) Spike waveforms of head direction cells recorded in the AM of the thalamus. (G) Autocorrelation ±1000 ms depicting characteristic temporal firing pattern.

