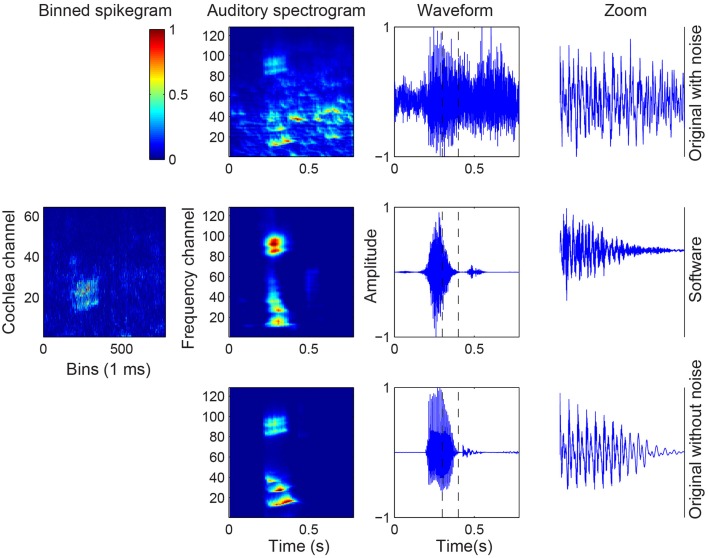
Figure 10.
Audio, binned spikegram, and auditory spectrogram plots for an example of a noisy digit with SNR of –10 dB. The mapped auditory spectrograms for the cochlea model spikes resemble better the auditory spectrograms of the original clean digit (bottom row). The binned spikegrams and auditory spectrograms are normalized.

