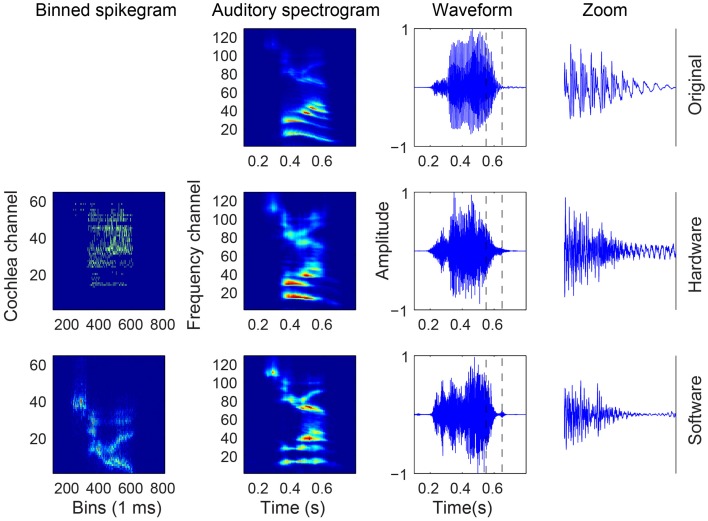
Figure 4.
Audio, binned spikegram, and auditory spectrogram plots for an example of digit “Z” from a female speaker (speaker FC, digit ZB). The responses of the software model come from a spikegram generated over 10 trials. The rightmost waveforms are zoomed-in parts of the entire waveform (third column from the left) in the region demarcated by the two vertical slashed lines. The binned spikegrams and auditory spectrograms are normalized in this figure.

