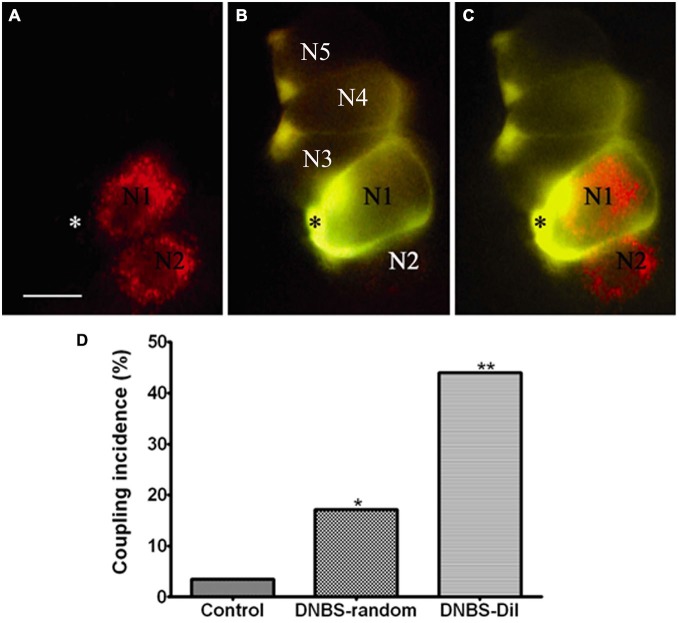
Figure 3.
Inflammation-induced changes in dye coupling between SGCs in the vicinity of neurons that innervate the colon. (A) A micrograph showing two DiI-labeled neurons (marked N1, N2), which innervate the colon. (B) An SGC (asterisk) near N1 was injected with LY. (C) Merged image obtained from (A) and (B) showing the relationship between DiI-labeled neurons and LY-injected SGC. Note that the LY-injected SGC is coupled to other SGCs that ensheathe unlabeled (presumably non-colonic) neurons. The images are of living cells during the injection experiment. Scale bar, 25 μm. (D) The histogram shows that SGCs coupling increased after the induction of inflammation. The effect was much greater when the dye-injected SGCs were in the vicinity of the DiI-labeled neurons compared with SGCs that were injected randomly throughout the ganglion. *p < 0.05, **p < 0.01. Modified from Huang et al. (2010).

