. 2015 Sep 3;4:e09248. doi: 10.7554/eLife.09248

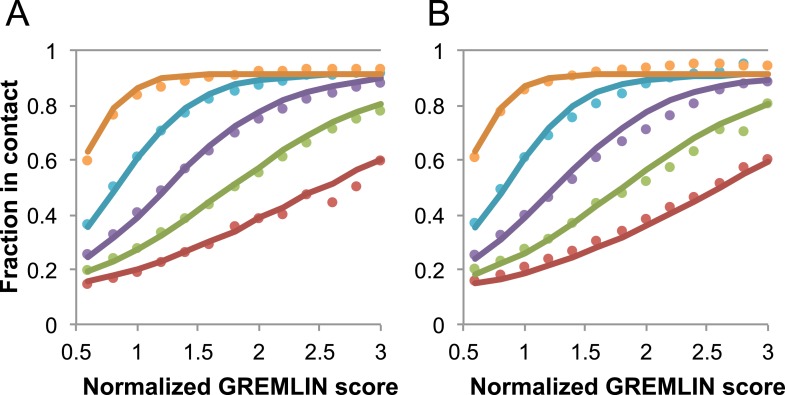
Figure 16. Dependence of the accuracy of predicted contacts on the normalized GREMLIN score (sco), the effective number of sequences (seq), the length (len), and the sequence separation (sep).

Contacts are defined based on amino acid specific Cβ-Cβ distance cutoffs as described in SI Table 3 in Kamisetty et al. (2013). (A) Observed vs predicted accuracies over a large data set of proteins of known structure with deep alignments (Supplementary file 3), sub sampled to different extents (seq/√(len) = 4 (red), 8 (green), 15 (purple), 32 (cyan), and 96 (orange)). Circles represent observed contact prediction accuracies, solid lines, a fit to a sigmoid function of the normalized coupling value, the number of sequences, the length, and the sequence separation (see Figure 16—figure supplement 1 and Figure 16—figure supplement 2). (B) Observed vs predicted accuracies in an independent data set of variable length alignments for 7047 pdb chains (Supplementary file 3), using maximum number of sequences obtained with HHblits as opposed to subsampling a large alignment. Circles again represent observed contact prediction accuracies; solid lines, the predicted accuracy using the model obtained by fitting to the data in (A). The contact prediction accuracy is correctly modeled for the independent data set, justifying its use on the unknown cases described in this article. The Equation use to calculate P(contact|sco,seq,len,sep) is
P(contact|sco,seq,len,sep)0.89(1P(contact|sep))1+exp(0.58(seqlen)0.50(sco5.46(seqlen)0.53))+P(contact|sep).

DOI: http://dx.doi.org/10.7554/eLife.09248.022

Figure 16.

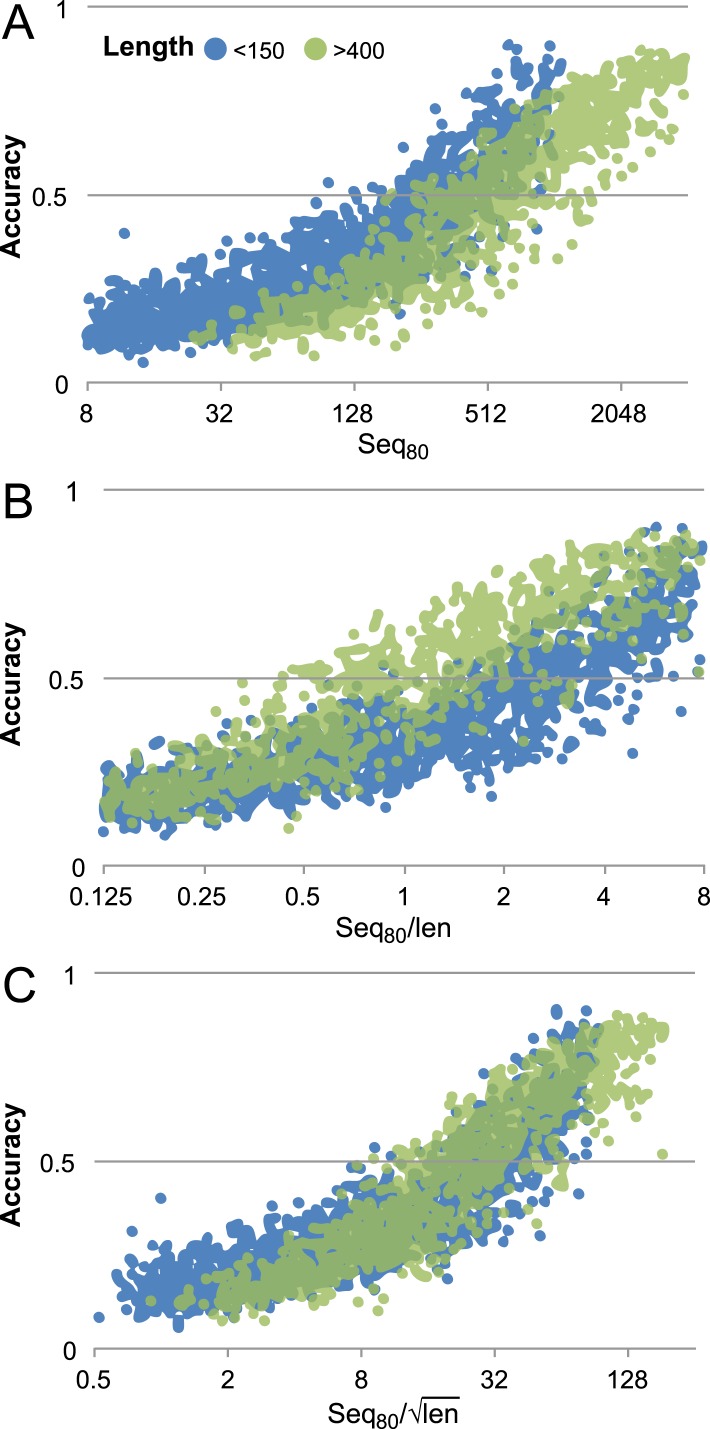
Figure 16—figure supplement 1. Contact prediction accuracy is better correlated with (#sequences/sqrt(length)) than with (#sequences/length).

Figure 16—figure supplement 1.

Accuracy is computed for the top 3L/2 GREMLIN predictions, with sequence separation ≥3, based on Cβ-Cβ amino acid specific distance as described in SI Table 3 in Kamisetty et al. (2013). The number of sequences after reducing the redundancy to 80% is shown. A set of 7047 pdb chains (see Supplemental file 3) was divided into two groups by length (less than 150 and greater than 400). (A) Larger proteins with similar number of sequence were less accurate then the smaller proteins. (B) #Sequences/length as often used does not accurately account for length dependence. There is a clear separation between the blue and green distributions. (C) #Sequences/√length better accounts for the length dependency. The blue and green distributions overlap.