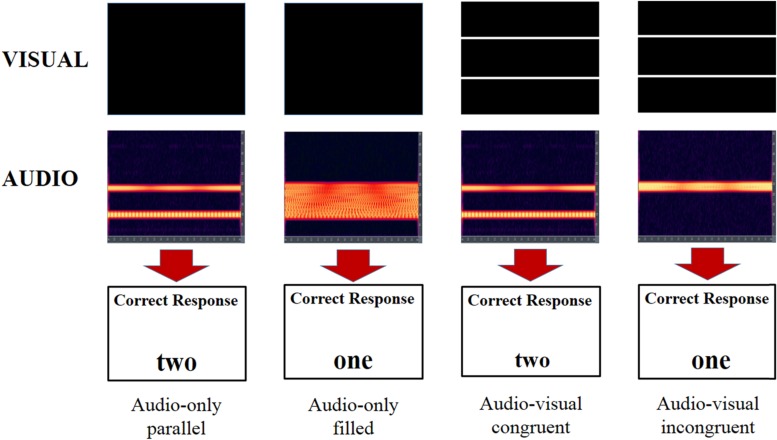
FIGURE 2.
Illustration of four different trial types. What the participant sees on screen is shown in the top row. Spectrographs of the audio signal the participant hears is shown in the second row with the correct response in the third row. The two trials on the left are audio-only trials with the two on the right congruent and incongruent audio–visual trials.

