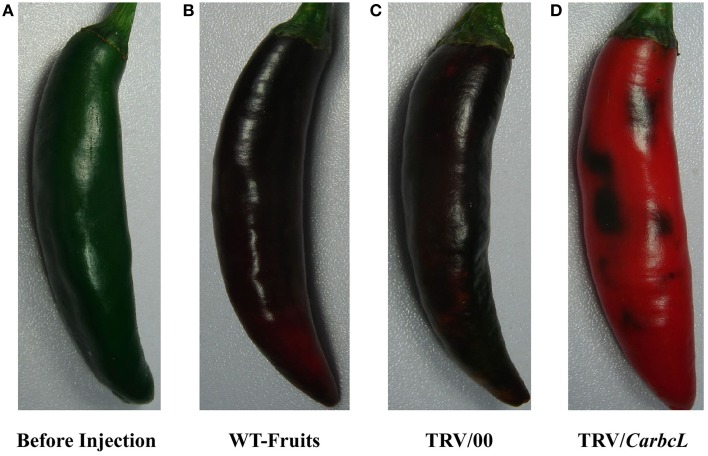
Figure 4.
Phenotypes of plants after CarbcL gene silencing. (A) Before injection, the color of fruits before the sample was treated; (B) WT-Fruits, the color of fruits in the control group after 10 days; (C) TRV/00, the color of fruits in the empty vector group after 10 days; (D) TRV/CarbcL, the color of fruits in the treatment group (fruits were injected TRV/CarbcL) after 10 days of treatment.

